Fixing CO2 - Carbon-concentrating mechanisms (CCMs):
Topics - scroll down to read more about:
- THE CALVIN CYCLE - RUBISCO - PHOTORESPIRATION
- CO2 FIXATION OPTIMIZATION - 6 CO2-FIXATION PATHWAYS FOUND IN NATURE - SYNTHETIC CO2-FIXATION PATHWAYS
- Hydrogen-dependent CO2 reductase (HDCR) - FORMATE AS FUEL AND STORAGE - INORGANIC CARBON UPTAKE - INTRACELLULAR CARBON TRANSPORT - CO2 DETECTION and CCM INDUCTION - THE CARBON CYCLE
With the advent of global warming (GW), there is growing interest in processes that couple CO2 capture to chemical synthesis through the use of photosynthetic microorganisms. Two inherent properties of cyanobacteria make them attractive candidates for use in bioindustrial applications: their photosynthetic capability and their capacity for genetic engineering. The inexpensive inputs required to fuel cyanobacterial metabolic processes – namely sunlight, CO2 and water, with few required mineral nutrients – are in contrast to carbohydrate feedstocks, which inherently require prior inputs to generate and refine. Sunlight is the most readily available and inexpensive source of energy on earth; the solar flux onto the United States alone is approximately 23,000 terawatts, and total US energy use is 3.16 terawatts [Savage, D.F. et al. (2008) Defossiling fuel: how synthetic biology can transform biofuel production. ACS Chem. Biol. 3, 13–16, and Repice, R. et al. (2010) Annual Energy Review 2009. U.S. Energy Information Administration]. Cyanobacteria convert captured solar energy into biomass in the field at efficiencies that generally exceed terrestrial plants (3–9% reported for cyanobacteria compared with <0.25–3% for terrestrial plants.
Source: Ducat, D. C., Way, J. C., & Silver, P. A. (2011). Engineering cyanobacteria to generate high-value products. Trends in Biotechnology, 29(2), 103–95. doi:10.1016/j.tibtech.2010.12.003.
Source: Ducat, D. C., Way, J. C., & Silver, P. A. (2011). Engineering cyanobacteria to generate high-value products. Trends in Biotechnology, 29(2), 103–95. doi:10.1016/j.tibtech.2010.12.003.
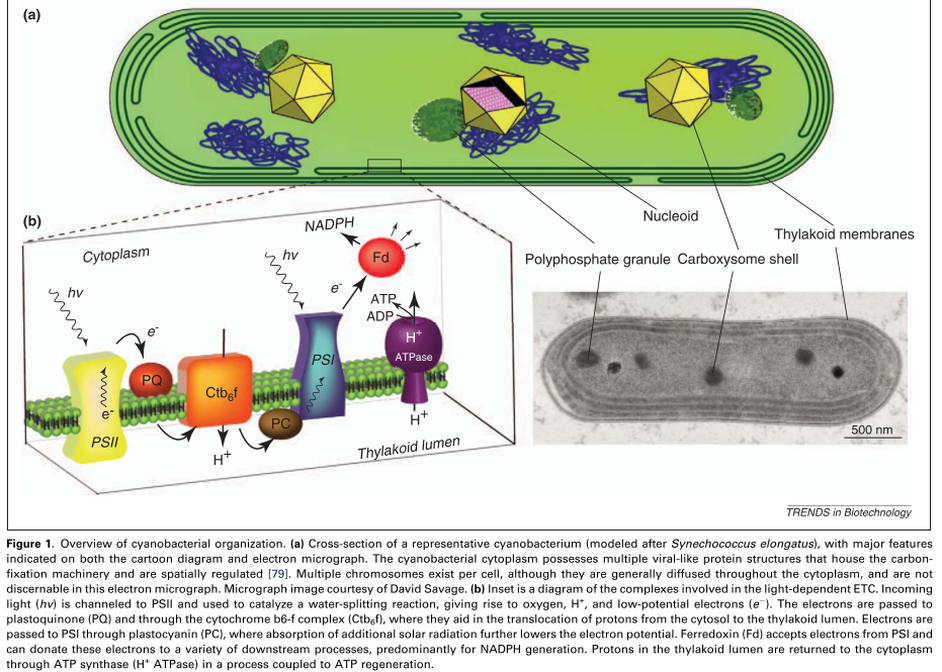
The engines underlying the production of all biological matter in plants and cyanobacteria are the light-converting reactions carried out by Photosystems I and II. Light energy is captured by thylakoid pigments and transferred to chlorophylls (chl) within the reactive core of the photosystems. Photosystem II (PSII) contains an active site that carries out the water-splitting reaction, while Photosystem I (PSI) raises the energy level of electrons it receives from the plastocyanin pool (Figure 1 above). Each photosystem demonstrates immense structural and mechanistic complexity (see below). The combined activity of PSII, PSI, and the electron transport chain (ETC) results in a reduction of NADP+ and the transfer of protons across the thylakoid membrane (thy), for an overall reaction of: 4 photons + NADP+ + H2O + 4H+ (cytoplasm) --> NADPH + O2 + 6H+ (thy). The translocated protons drive ATP synthesis and the resultant ATP and NADPH drive the Calvin Cycle for carbon fixation:
The Calvin Cycle, earlier designated the photosynthetic "dark reactions" pathway, is where the free energy of cleavage of phosphate bonds of ATP, and reducing power of NADPH, are used to fix and reduce CO2 to form carbohydrate. Enzymes and intermediates of the Calvin Cycle in plants and eukaryotic algae are located in the chloroplast stroma (In unicellular cyanobacteria with CO2-concentrating mechanisms, Rubisco is specifically localized to structures known as carboxysomes (Allen, 1984; Codd and Marsden, 1984). Recent studies of the cyanobacteria's CO2-concentrating mechanism indicate that HCO3− accumulated by the cell is dehydrated specifically in the carboxysome, where the resulting CO2 can be fixed before leaking out of the cell (Badger and Price, 1994). Models of this process have also been proposed (Reinhold et al., 1991).
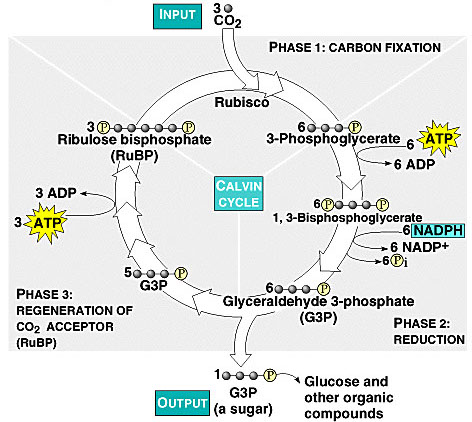
Ribulose Bisphosphate Carboxylase (RuBisCO or RuBP Carboxylase) catalyzes CO2 fixation:
(6 cycles)
Ribulose-1,5-bisphosphate + CO2 ====> 2 copies of 3-phosphoglycerate (G3P or 3PG)
RuBisCO (RuBP Carboxylase):
Because it can alternatively catalyze an oxygenase reaction, the enzyme is also called RuBP Carboxylase/Oxygenase (RuBisCO). It is the most abundant enzyme on earth. The RuBP Carboxylase reaction mechanism involves extraction of a proton from carbon atom C3 of ribulose-1,5-bisphosphate (RuBP, far left), which promotes formation of an endiolate intermediate. Nucleophilic attack on CO2 is proposed to yield a b-keto acid intermediate that reacts with water and cleaves to form 2 molecules of 3-phosphoglycerate (G3P or 3PG). For each 3PG synthesized, the cycle spends nine molecules of ATP and six molecules of NADPH2: http://www.science.smith.edu/departments/Biology/Bio231/calvin.html. It has been estimated that about 4×10e13 g (40 Mt) of RuBisCO exists in the biosphere, which would correspond to an intangible 5 kg of RuBisCO per person on earth (Phillips R., Milo R.. 2009. A feeling for the numbers in biology. Proc. Natl. Acad. Sci. U.S.A. 106:21465–21471).
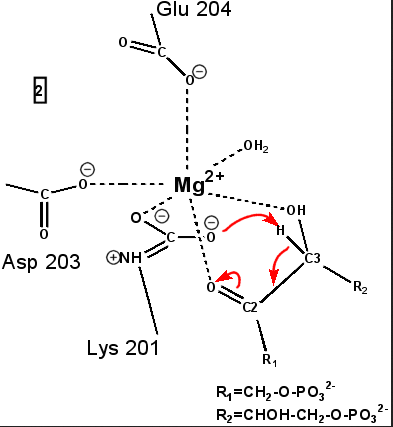
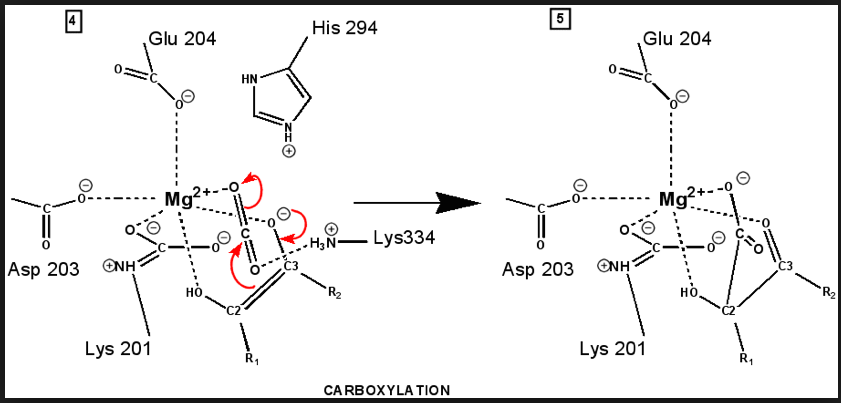
"Active" RuBP Carboxylase includes a carbamate group, that binds an essential Mg++ at the active site. The carbamate forms by reaction of HCO3- with the e-amino group of a lysine residue of RuBP Carboxylase, in the presence of Mg++. HCO3- that reacts to form the carbamate group is distinct from CO2 that binds to RuBP Carboxylase as substrate, RuBisCO utilizes CO2 as the "active CO2” species in the Calvin-Bassham-Benson cycle, whereas it is bicarbonate (HCO3-) in most other carboxylation reactions. The active site Mg++ bridges between oxygen atoms of the carbamate and the substrate CO2.
The
carbamate exists in the aci form, and only
coordinates the magnesium ion with one of the carbamate oxygens: this
leaves sufficient rotational freedom for the other one to play a
central role in many of the proton transfers during carbon fixation. Before CO2 which is to be fixed enters the active site the magnesium ion is octahedrally coordinated by six ligands. Three ligands come from the protein and two from RuBP. The sixth ligand (not shown) is water (OH2 ligand). Asp203 and glu204 and modified lys201 provide three coordinating oxygen atoms (shown in red). RuBP occupies two coordination sites. The discovery that RuBP is cis rather than trans had to await sufficiently well defined electron density maps to distinguish the conformations of RuBP - not a trivial task with such a large enzyme. The 'carbamate' CO2 (not the CO2 which will be fixed) contributes one of its oxygen atoms as a ligand to the Mg2+ ion. The other oxygen atom is free to act as an acid-base catalyst. Now the catalytic site is ready to fix CO2. This CO2 enters the active site from a preferred direction and binds stereospecifically to C-2 in step 4-5. It also displaces water as the sixth ligand around the magnesium ion:

RuBP is anchored in the active site by its two phosphate groups, P1 and P2 (a243). Later in the reaction, when the C-C bond breaks and two molecules of 3-phospho-D-glycerate form, these anchors remain in place. The reprotonation of atom C-2 step 7-8, which follows C-C bond fission, depends crucially on the phosphate anchors. As alluded to earlier, stereochemistry prevents the carbamate adding the proton to C-2. It is the acid/base catalytic group lys175, lying orthogonal to the carbamate (a330) which is ideally placed for the reprotonation. While the carbamate on lys201 hardly moves at all (a331), lys175 moves, seemingly further from C-2 (a332) . However a crucial rotation, minimally disturbing the phosphate anchors, moves C-2 about 1 Å closer to the nitrogen on lys175( a333), close enough to allow reprotonation.
 RuBisCO homodimer of L2 plus 2 S2 subunits
RuBisCO (RuBP Carboxylase) in plants is a complex (L8, S8) of:
- 8 large catalytic subunits (L, 477 amino acid residues)
- 8 small subunits (S, 123 amino acid residues).
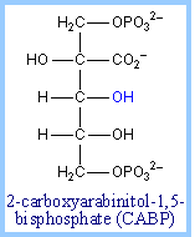 CABP - a RuBiscCO inhibitor
Binding of either the normal substrate ribulose-1,5-bisphosphate or a transition state analog to RuBP Carboxylase causes a conformational change to a "closed" conformation in which access of solvent water to the active site is blocked. Transition state analogs of the postulated b-keto acid intermediate bind tightly to the enzyme and inhibit its activity. Examples include 2-carboxyarabinitol-1,5-bisphosphate (CABP, at left and carboxyarabinitol-1-phosphate (CA1P).
RuBP Carboxylase (RuBisCO) can spontaneously deactivate by decarbamylation. In the absence of the carbamate group, RuBisCO tightly binds ribulose bisphosphate (RuBP) or another sugar phosphate at the active site as a "dead end" complex, with the closed conformation, and is inactive in catalysis. In order for the carbamate to reform, the enzyme must undergo transition to the open conformation.
RuBP Carboxylase Activase, an ATP hydrolyzing (ATPase) enzyme, causes a conformational change in RuBP Carboxylase from closed to open form. This allows release of tightly bound RuBP or other sugar phosphate from the active site, and carbamate formation. Since photosynthetic light reactions produce ATP, the ATP dependence of RuBisCO activation provides a mechanism for light-dependent activation of the enzyme. RuBP Carboxylase Activase is a member of the AAA family of ATPases, many of which have chaperone-like roles. The activase is a large multimeric protein complex that may surround RuBP Carboxylase while inducing the conformational change to the open state.
Photorespiration:
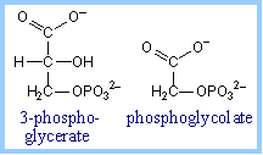
Photorespiration: O2 can compete with CO2 for binding to RuBisCO, especially when [CO2] is low and [O2] is high (= low ratio of CO2/O2). Reaction of O2 with ribulose-1,5-bisphosphate yields one molecule of 3-phosphoglycerate plus the 2-carbon compound 2-phosphoglycolate. This reaction is the basis for the name RuBP Carboxylase/ Oxygenase (RuBisCO).
The complex pathway that partly salvages carbon from 2-phosphoglycolate, via conversion to 3-phosphoglycerate, involves enzymes of chloroplasts, peroxisomes and mitochondria. This pathway recovers 3/4 of the carbon from 2-phosphoglycolate as 3-phosphoglycerate while the rest is released as CO2. Photorespiration is a wasteful process, substantially reducing efficiency of CO2 fixation.
The complex pathway that partly salvages carbon from 2-phosphoglycolate, via conversion to 3-phosphoglycerate, involves enzymes of chloroplasts, peroxisomes and mitochondria. This pathway recovers 3/4 of the carbon from 2-phosphoglycolate as 3-phosphoglycerate while the rest is released as CO2. Photorespiration is a wasteful process, substantially reducing efficiency of CO2 fixation.
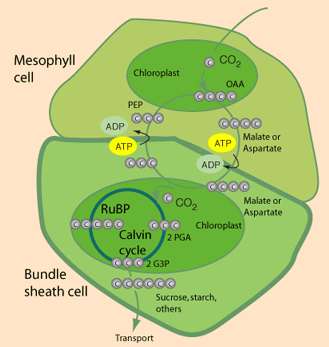
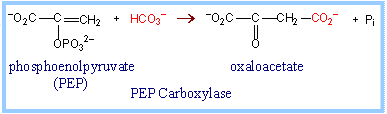
C3 vs C4 plants: Most plants, designated C3, fix CO2 initially via RuBP Carboxylase, yielding the 3-carbon compound 3-phosphoglycerate (3PG). Plants designated C4 have one cell type in which phosphoenolpyruvate (PEP) is carboxylated via the enzyme PEP Carboxylase, to yield the 4-carbon compound oxaloacetate. The oxaloacetate is converted to other 4-carbon intermediates that are transported to cells active in photosynthesis, where CO2 is released by decarboxylation. This is how C4 plants maintain a high ratio of CO2/O2 within photosynthetic cells thereby minimizing photorespiration. Transporting C4 molecules out of mesophyll cells to bundle sheath cells and PEP vice versa is however an ATP dependent (energy requiring) process.
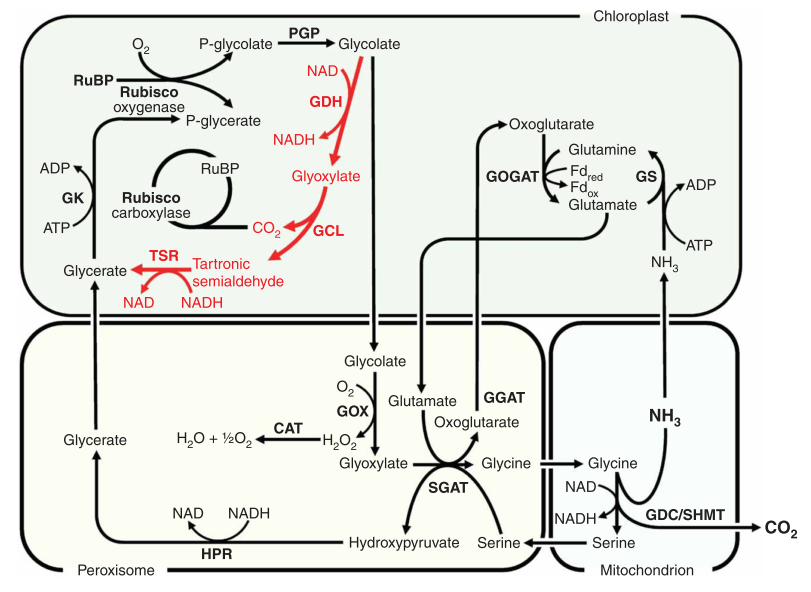
Some research has been aimed at increasing expression of and/or inserting genes for C4 pathway enzymes, such as PEP Carboxylase, in C3 plants: in 2007 Kebeish et al. (11) introduced the Escherichia coli glycolate catabolic pathway into Arabidopsis thaliana chloroplasts to reduce the loss of fixed carbon and nitrogen that occurs in C3 plants when phosphoglycolate, an inevitable by-product of photosynthesis, is recycled by photorespiration. Using step-wise nuclear transformation with five chloroplast-targeted bacterial genes encoding glycolate dehydrogenase, glyoxylate carboligase and tartronic semialdehyde reductase, they generated plants in which chloroplastic glycolate is converted directly to glycerate. This reduces, but does not eliminate, flux of photorespiratory metabolites through peroxisomes and mitochondria. Transgenic plants grew faster, produced more shoot and root biomass, and contained more soluble sugars, reflecting reduced photorespiration and enhanced photosynthesis that correlated with an increased chloroplastic CO2 concentration in the vicinity of ribulose-1,5-bisphosphate carboxylase/oxygenase. These effects are evident after overexpression of the three subunits of glycolate dehydrogenase, but enhanced by introducing the complete bacterial glycolate catabolic pathway. Diverting chloroplastic glycolate from photorespiration may improve the productivity of crops with C3 photosynthesis.
Figure at right: The E. coli glycolate catabolic pathway (red) superimposed on plant photorespiration (black): Rubisco, ribulose-1,5-bisphosphate carboxylase/oxygenase; RuBP, ribulose-1,5-bisphosphate; PGP, phosphogycolate phosphatase; GOX, glycolate oxidase; CAT, catalase; GGAT, glyoxylate/glutamate aminotransferase; GDC/SHMT, glycine decarboxylase/serine hydroxymethyl transferase; SGAT, serine/glyoxylate aminotransferase; HPR, hydroxypyruvate reductase; GK, glycerate kinase; GS, glutamine synthetase; GOGAT, glutamate/oxoglutarate aminotransferase; Fdred, reduced ferredoxin; Fdox, oxidized ferredoxin; GDH, glycolate dehydrogenase; GCL, glyoxylate carboxyligase; P-glycerate; phosphoglycerate; TSR, tartronic semialdehyde reductase.
Figure at right: The E. coli glycolate catabolic pathway (red) superimposed on plant photorespiration (black): Rubisco, ribulose-1,5-bisphosphate carboxylase/oxygenase; RuBP, ribulose-1,5-bisphosphate; PGP, phosphogycolate phosphatase; GOX, glycolate oxidase; CAT, catalase; GGAT, glyoxylate/glutamate aminotransferase; GDC/SHMT, glycine decarboxylase/serine hydroxymethyl transferase; SGAT, serine/glyoxylate aminotransferase; HPR, hydroxypyruvate reductase; GK, glycerate kinase; GS, glutamine synthetase; GOGAT, glutamate/oxoglutarate aminotransferase; Fdred, reduced ferredoxin; Fdox, oxidized ferredoxin; GDH, glycolate dehydrogenase; GCL, glyoxylate carboxyligase; P-glycerate; phosphoglycerate; TSR, tartronic semialdehyde reductase.
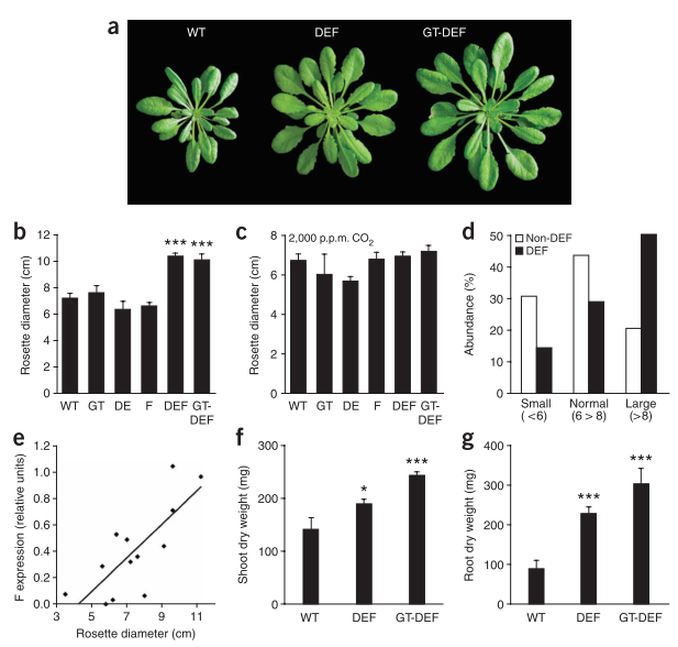
Figure above: Growth parameters of transgenic (DEF, GT-DEF) and wild-type (WT) Arabidopsis thaliana lines: (a) Representative photographs of selected transgenic plants. (b) Rosette diameters of plants grown at ambient conditions. (c) Rosette diameters of plants grown at elevated CO2 (2,000 p.p.m.). (d) Abundances of small (<6 cm rosette diameter), normal (6-8 cm) and large (>8 cm) plants in a segregating population dependent on the genotype. DEF, plants containing the DE and F transgenes; non-DEF, all other genotypes. (e) Correlation of abundance of transcript encoding the F subunit of GDH with rosette diameter in descendants from a segregating population. (f) Shoot dry weights of plants grown under ambient conditions. (g) Root dry weights of plants grown under ambient conditions. DEF, plants overexpressing subunits D, E, and F of E. coli glycolate dehydrogenase; GT-DEF, plants overexpressing the complete E. coli glycolate catabolic pathway as shown in above figure. Each data point represents at least five independent plants. Error bars indicate s.e.m.; *, P < 0.05; **, P < 0.01; ***, P < 0.001 according to Student's t-test. Plants were selected on appropriate antibiotics for 2 weeks and then grown in soil for 6 weeks. Plants analyzed in d and e were directly grown in soil without antibiotic selection.
Regulation of the Calvin Cycle:
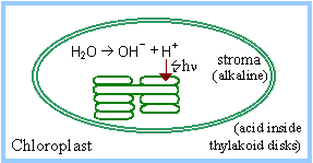
Regulation prevents the Calvin Cycle from being active in the dark, when it might function in a futile cycle with Glycolysis and Pentose Phosphate Pathways, wasting ATP and NADPH. Light activates, or dark inhibits, the Calvin Cycle (previously called the "dark reaction") in several ways. Light-activated electron transfer is linked to pumping of H+ into thylakoid disks. The pH in the stroma increases to about 8. The alkaline pH activates stromal Calvin Cycle enzymes RuBP Carboxylase, Fructose-1,6-Bisphosphatase and Sedoheptulose Bisphosphatase.
The light-activated shift of H+ into thylakoid discs is countered by Mg++ release from the thylakoids to the stroma. RuBP Carboxylase (in the stroma) requires Mg++ binding to carbamate at the active site. Some plants synthesize the transition-state inhibitor carboxyarabinitol-1-phosphate (CA1P) in the dark. RuBP Carboxylase Activase facilitates release of CA1P from RuBP Carboxylase, when it is activated under conditions of light via thioredoxin. During illumination, the thioredoxin disulfide is reduced to a dithiol by ferredoxin, a constituent of the photosynthetic light reaction pathway, via an enzyme Ferredoxin-Thioredoxin Reductase. The reduced thioredoxin activates several Calvin Cycle enzymes, including Fructose-1,6-bisphosphatase, Sedoheptulose-1,7-bisphosphatase, and RuBP Carboxylase Activase, by reducing specific disulfides in these enzymes to thiols.
Ultimately, the effectiveness of any cyanobacterial production regime is limited by the theoretical maximal efficiency for photosynthesis, which is calculated to be approximately 11%, but typically falls significantly below this value (<1%). The efficiency of cyanobacterial production is a central issue. Light and CO2 are the key feedstocks for cyanobacterial production - these factors limit production of cellular biomass; therefore, in evaluating the performance of a genetic system, one can compare the rate of product synthesis to the rate of biomass production of the corresponding non-engineered organism to normalize for both light and CO2 delivery, which can vary from one laboratory to the next.
Optimization of RuBisCO and CO2 fixation
RuBisCO is the notoriously inefficient enzyme driving at the core of the Calvin Cycle, which drives the vast majority of global carbon fixation [1-3]. As a result, there has been long-standing interest in increasing the effectiveness of this enzyme in photosynthetic organisms. Engineering efforts to improve activity of RuBisCO have revealed an inherent inverse relationship between the catalytic activity of RuBisCO and its specificity for CO2 over O2 [1,4]. Naturally occurring or mutant forms of RuBisCO with higher catalytic activity are less able to recognize CO2 preferentially, and therefore, are prone to higher rates of photorespiration; there are no engineered examples of amore effective RuBisCO molecule to date (Ducat et al. 2011, Trends in Biotechnology).
Successful engineering of RuBisCO for increased photosynthetic efficiencies will likely involve increasing expression levels or poising activity/specificity to capitalize on recent atmospheric changes. However, native photosynthetic organisms must balance RuBisCO expression with that of many protective/defensive pathways, and optimized strains grown in monoculture can support higher expression of RuBisCO. This would bring RuBisCO levels closer to the predicted concentration required to maximize carbon fixation under full illumination [4]. During the course of isobutanol production, Atsumi et al. have overexpressed the RuBisCO operon in Synechococcus elongatus, thereby boosting production levels by two-fold [5]. This strategy for increased yields might be broadly applied to many photosynthetic microorganisms within the context of a bioreactor [4,6]. RuBisCO within many agricultural crops appears to be better optimized for stable CO2 levels prior to the Industrial Revolution (200– 260 ppm) [7] than for the current atmospheric concentration (>385 ppm) [8]. Simulations have suggested that photosynthetic organisms that possess RuBisCO tailored for present-day CO2 levels could fix >10% more carbon with the same inputs [8]. In general, the negative correlation between the enzyme turnover number and its CO2 specificity indicates that the enzyme might already be naturally optimized. Therefore, further optimization of RuBisCO may prove difficult and lead to only marginal improvements.
Swapping endogenous RuBisCOs for naturally occurring isoforms with higher catalytic activity (and reduced CO2 specificity) could theoretically increase yields in the context of the present atmosphere, or within CO2-enriched bioreactors. Another option to increase rates of carbon-fixation for organisms in CO2-enriched reactors is to overexpress alternative carbon utilization pathways.
Although RuBisCO is the dominant carbon-fixing enzyme in nature, five other natural biochemical pathways exist to capture dissolved CO2 [9]. These pathways, or portions of these pathways recombined in novel, synthetic carbon-fixation pathways have been proposed as methods to increase efficiencies of carbon uptake [10], Figure 1:
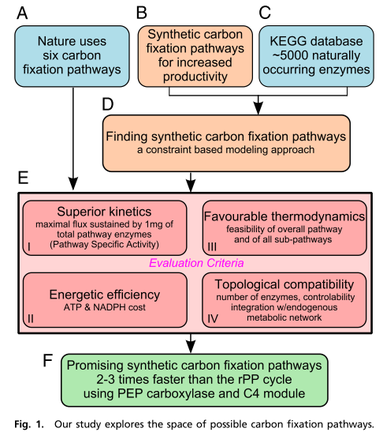
Bar-Even et al. began with analyzing natural metabolic pathways for carbon fixation (Fig. 1A) and progressed to the exploration of possible synthetic alternatives (Fig. 1B) while restricting ourselves exclusively to naturally occurring enzymes. We considered the entire set of approximately 5,000 known metabolic enzymes as components (Fig. 1C) and used a constraint-based modeling approach that systematically explored all possibilities that can be devised with these enzymes as building blocks (Fig. 1D). Their analysis presents several promising synthetic carbon fixation pathways and implements a methodical set of analysis metrics to compare the natural and synthetic pathways (Fig. 1E). Focusing on the cycle kinetics, they developed a proxy measure for the overall specific rates of each pathway, a criterion that can be highly important from an evolutionary point of view. They found that some of the proposed synthetic pathways could have significant kinetic advantages over their natural counterparts, making them promising candidates for synthetic biology implementation (Fig. 1F).
To date, five natural metabolic pathways that perform carbon fixation in place of the classic Calvin cycle (or reductive pentose-phosphate "rPP" cycle) have been identified. These are the reductive tricarboxylic acid ("rTCA") cycle, postulated in the 1960s (12); the oxygen-sensitive reductive acetyl-CoA (rAcCoA) pathway (13); the extensively researched 3-hydroxypropionate cycle "3-HP cycle" (14); the 3-hydroxypropionate/4-hydroxybutyratecycle "3-HP/4-HB cycle" (15); and the recently discovered dicarboxylate/4-hydroxybutyrate cycle "DC/4-HB cycle" (16), summarized in Table 1 below as well as proposed "synthetic" enzyme pathways (see further details of pathways in figures below):
To date, five natural metabolic pathways that perform carbon fixation in place of the classic Calvin cycle (or reductive pentose-phosphate "rPP" cycle) have been identified. These are the reductive tricarboxylic acid ("rTCA") cycle, postulated in the 1960s (12); the oxygen-sensitive reductive acetyl-CoA (rAcCoA) pathway (13); the extensively researched 3-hydroxypropionate cycle "3-HP cycle" (14); the 3-hydroxypropionate/4-hydroxybutyratecycle "3-HP/4-HB cycle" (15); and the recently discovered dicarboxylate/4-hydroxybutyrate cycle "DC/4-HB cycle" (16), summarized in Table 1 below as well as proposed "synthetic" enzyme pathways (see further details of pathways in figures below):
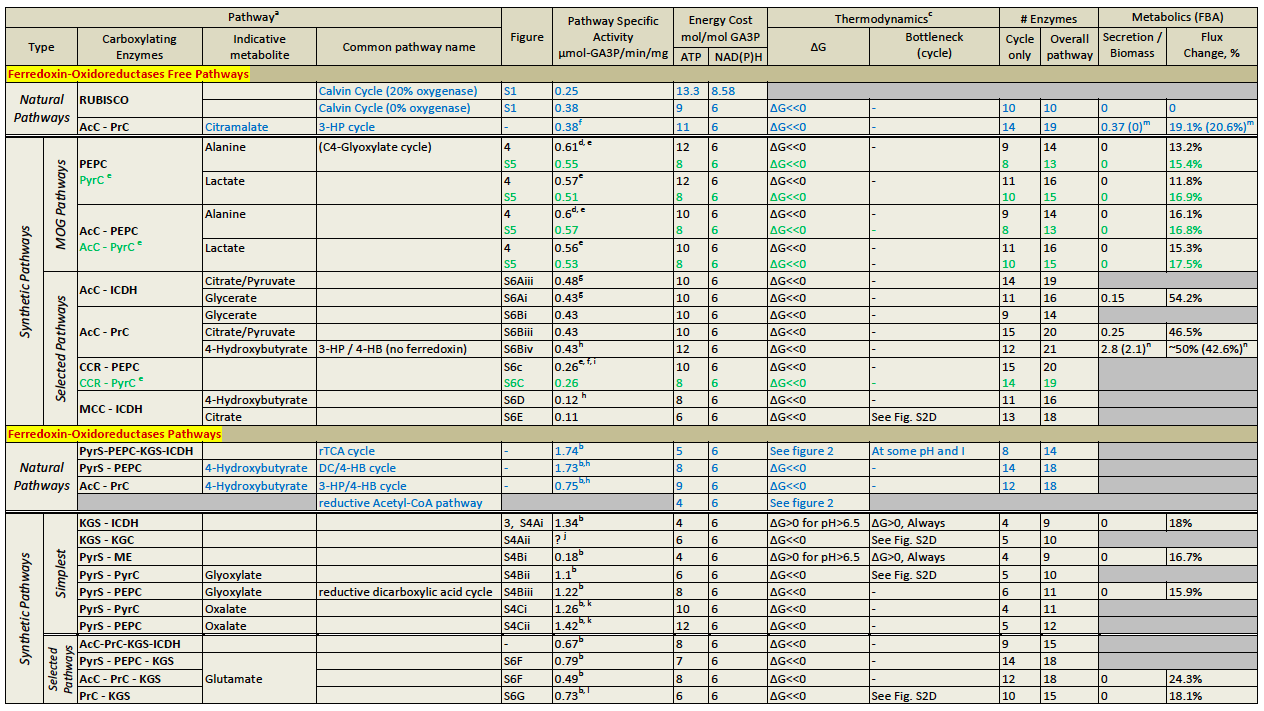
AcC, acetyl-CoA carboxylase; PrC, propionyl-CoA carboxylase; ICDH, isocitrate dehydrogenase; CCR, crotonyl-CoA carboxylase/reductase; MMC, methylcrotonyl-CoA carboxylase.
a). Pathways marked in blue are natural carbon fixation pathways. Pathway notation and a comprehensive discussion is given in the SI Appendix.
b). The pathway specific activities of the ferredoxin-oxidoreductase pathways are artificially high because their calculations do not include the specific activities of the ferredoxin-oxidoreductase enzymes; see main text.
c). See Figures below for further details on the energetics of the carbon fixation pathways.
d). The specific activity of the enzyme alanine 2,3-aminomutase is not known, and therefore not included in the calculation of the pathway specific activity, which might be somewhat lower.
e). Refers to a pathway using the enzymes PEP caboxylase and pyruvate dikinase. The values given in green, at the raw below, refer to a pathway utilizing the enzyme pyruvate carboxylase.
f). The enzyme which converts mesaconyl-CoA into citramalate is not known. Therefore, its specific activity was not included in the calculation of the specific activity of the pathway, which might be somewhat lower.
g). The specific activity of the enzyme 2-hydroxyglutarate synthase is not known, and therefore not included in the calculation of the pathway specific activity, which might be somewhat lower.
h). The specific activity of the enzyme 4-hydroxybutyryl-CoA synthetase is not known, and therefore not included in the calculation of the pathway specific activity, which might be somewhat lower.
i). The enzyme which converts methylsuccinyl-CoA into mesaconyl-CoA is not known. Therefore, its specific activity was not included in the calculation of the pathway specific activity, which might be somewhat lower.
j). The specific activity of the carboxylating enzyme 2-ketoglutarate carboxylase is not known and therefore the pathway specific activity was not calculated.
k). The specific activity of the enzyme oxalate CoA ligase is not known, and therefore not included in the calculation of the pathway specific activity, which might be somewhat lower.
l). The enzyme which converts mesaconate into mesaconyl-CoA is not known. Therefore, its specific activity was not included in the calculation of the specific activity of the pathway, which might be somewhat lower.
m). The value out of the parentheses refers to a cycle in which the succinate dehydrogenase utilizes ubiquinone. The value inside of the parentheses refers to a cycle in which the succinate dehydrogenase utilizes NADPH (a non-natural co-factor for this enzyme). See SI Appendix.
n). The value out of the parentheses refers to a cycle in which the glyoxylate shunt utilizes ubiquinone or FAD. The value inside of the parentheses refers to a cycle in which the glyoxylate shunt utilizes NADPH.
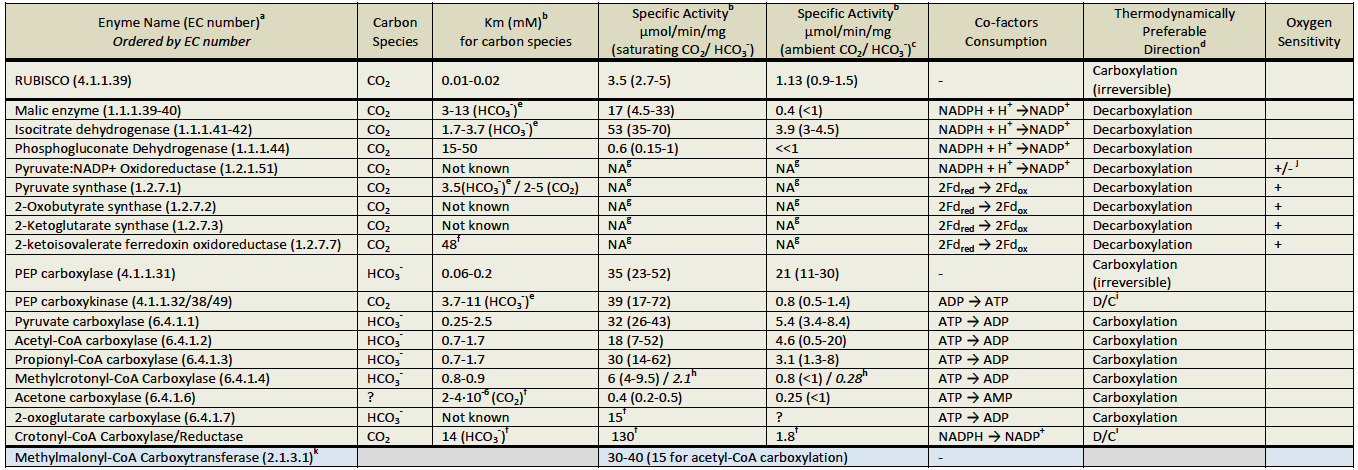
a). Several carboxylating enzymes were not evaluated: (1) "dead-end" carboxylating enzymes (carbamate kinase, urea carboxylase and carbamoyl-phosphate synthase); (2) enzymes that are specific to high molecular-weight-metabolites (indole pyruvate ferredoxin oxidoreductase, 2-oxopropyl-CoM reductase, phosphoribosylaminoimidazole carboxylase and geranoyl-CoA carboxylase) and (3) the reductive acetyl-CoA pathway's enzymes (carbon monoxide dehydrogenase, formate dehydrogenase and acetyl-CoA synthase).
b). Km and specific activity (saturating CO2 / HCO3-) values were collected from the literature. Specific activities in ambient CO2 / HCO3- were calculated by assuming Michaelis‐Menten kinetics with no cooperativity. For each enzyme and for all the three criteria the worse half of values (the less optimized enzymes) was discarded as well as the top 10% (which might present outliers and errors in measurements). The table shows the average of the remaining values, and their range in parentheses.
c). CO2 concentration was estimated as 10 μM, while HCO3- concentration was conservatively estimated as 200μM (Berg, I. A., Kockelkorn, D., Buckel, W., & Fuchs, G. (2007). A 3-hydroxypropionate/4-hydroxybutyrate autotrophic carbon dioxide assimilation pathway in Archaea. Science (New York, N.Y.), 318(5857), 1782–6. doi:10.1126/science.1149976).
d). Under common physiological conditions.
e). Although the carbon species utilized in CO2, affinity was measured using varied concentrations of bicarbonate.
f). Values taken from one paper only.
g). Scarcity of literature information about the carboxylation reaction, as well as extreme oxygen sensitivity disabled reliable specific activity estimation.
hValues in Italics correspond to carboxylation rates of crotonyl-CoA (approximately 35% of methylcrotonyl-CoA).
i). Rate of carboxylation, under saturating CO2 / HCO3-, is higher than that of decarboxylation. However, under ambient CO2 / HCO3- the decarboxylation rate is higher.
j). The enzyme is inactivated by the direct action of O2. However, the enzyme is operating (and remain active) in the mitochondria of Euglena grown aerobically where it is stabilized by its co-factor: thiamine diphosphate.
k). Although this enzyme is not a carboxylating one per se, it can be used instead of a true carboxylating enzyme.
6 CO2 fixation pathways found in nature:
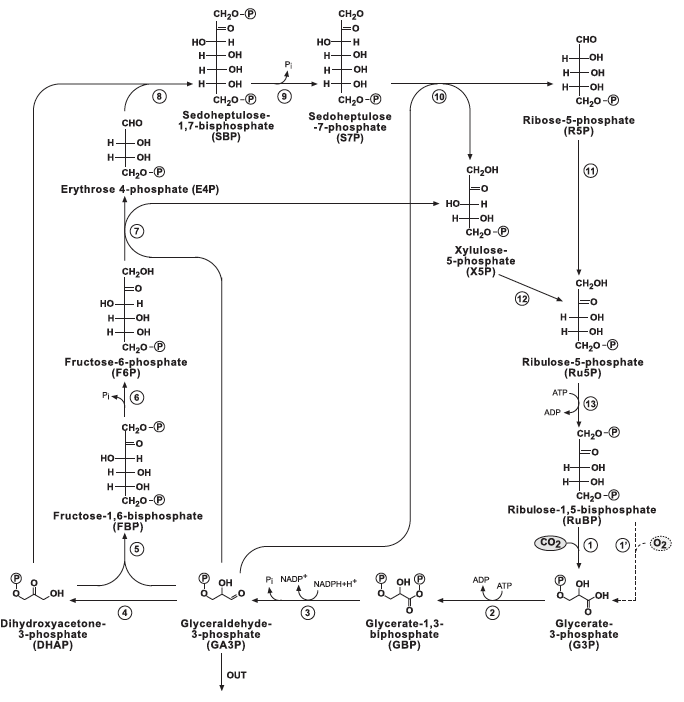
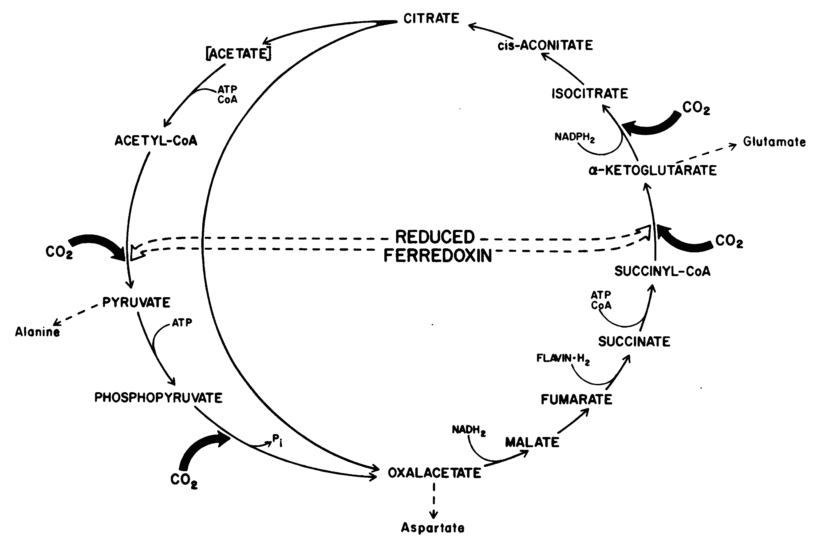
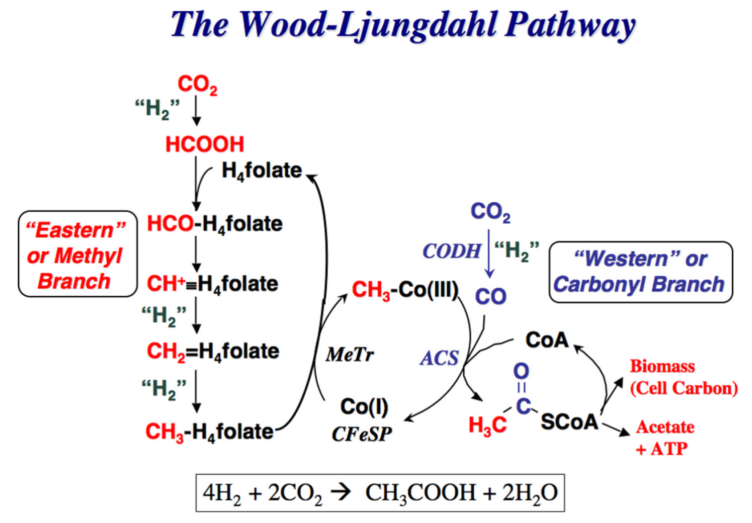
6 CO2 fixation pathways found in nature are depicted below: Figure 1: "rPP/Calvin cycle", Figure 2: reductive tricarboxylic acid ("rTCA cycle"), Figure 3: oxygen-sensitive reductive acetyl-CoA pathway ("rAcCoA cycle"), Figure 4: 3-hydroxypropionate cycle "3-HP cycle", Figure 5: 3-hydroxypropionate/4-hydroxybutyratecycle "3-HP/4-HB cycle", Figure 6: dicarboxylate/4-hydroxybutyrate cycle "DC/4-HB cycle":
Legends for Figures above:
1.) "rPP/Calvin cycle": The reductive pentose phosphate cycle. Dashed line corresponds to RUBISCO's oxygenase reaction and to the photorespiration pathway. Glyceraldehyde-3-Phosphate (G3p) is considered as the pathway product. Bar-Even et al 2010.
2.) "rTCA cycle": reductive carboxylic acid cycle in C. thiosulfatophilum. One turn of the complete cycle (represented by the one-sided ellipse) results in the incorporation of four molecules of C02. One turn of the short cycle (represented by the circle) results in the incorporation of two molecules of CO2.
3.) "rAcCoA cycle": the Wood-Ljungdahl pathway converts hydrogen gas and carbon dioxide to acetic acid e.g. in Moorella thermoacetica.
Legends for Figures above:
4.) "3-HP cycle": Proposed 3-hydroxypropionate cycle of autotrophic CO2 fixation in Chloroflexus aurantiacus. Enzyme 1, acetyl-CoA; 2, malonyl-CoA;3, 3-hydroxypropionate; 4, propionyl-CoA;5, methylmalonyl-CoA; 6, succinyl-CoA;7, malate; 8, malyl-CoA; 9, glyoxylate.
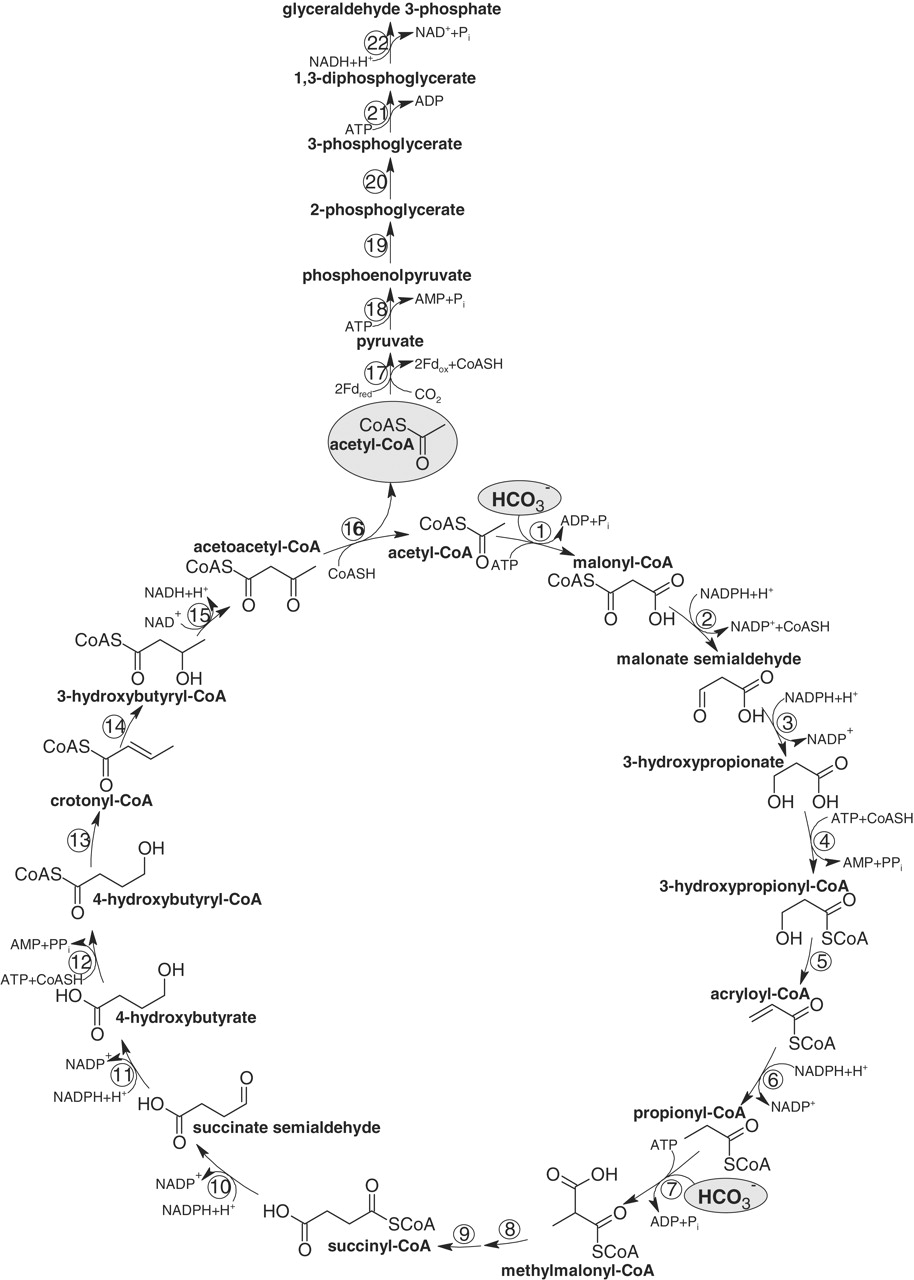
5.) "3-HP/4-HB cycle": Proposed autotrophic 3-hydroxypropionate/4-hydroxybutyrate cycle in Metallosphaera sedula. Reactions of the cycle are shown. Enzymes: 1, acetyl-CoA carboxylase; 2, malonyl-CoA reductase (NADPH); 3, malonate semialdehyde reductase (NADPH); 4, 3-hydroxypropionyl-CoA synthetase (AMP-forming); 5, 3-hydroxypropionyl-CoA dehydratase; 6, acryloyl-CoA reductase (NADPH); 7, propionyl-CoA carboxylase; 8, methylmalonyl-CoA epimerase; 9, methylmalonyl-CoA mutase; 10, succinyl-CoA reductase (NADPH); 11, succinate semialdehyde reductase (NADPH); 12, 4-hydroxybutyryl-CoA synthetase (AMP-forming); 13, 4-hydroxybutyryl-CoA dehydratase; 14, crotonyl-CoA hydratase; 15, 3-hydroxybutyryl-CoA dehydrogenase (NAD+); 16, acetoacetyl-CoA β-ketothiolase. The proposed pathway of glyceraldehyde 3-phosphate synthesis from acetyl-CoA and CO2 is also shown. Enzymes: 17, pyruvate synthase; 18, pyruvate, water dikinase [phosphoenolpyruvate (PEP) synthase]; 19, enolase; 20, phosphoglycerate mutase; 21, 3-phosphoglycerate kinase; 22, glyceraldehyde 3-phosphate dehydrogenase. The activities of pyruvate synthase and PEP synthase at 75°C were 10 to 25 nmol min–1 mg–1 protein and 25 nmol min–1 mg–1 protein, respectively.
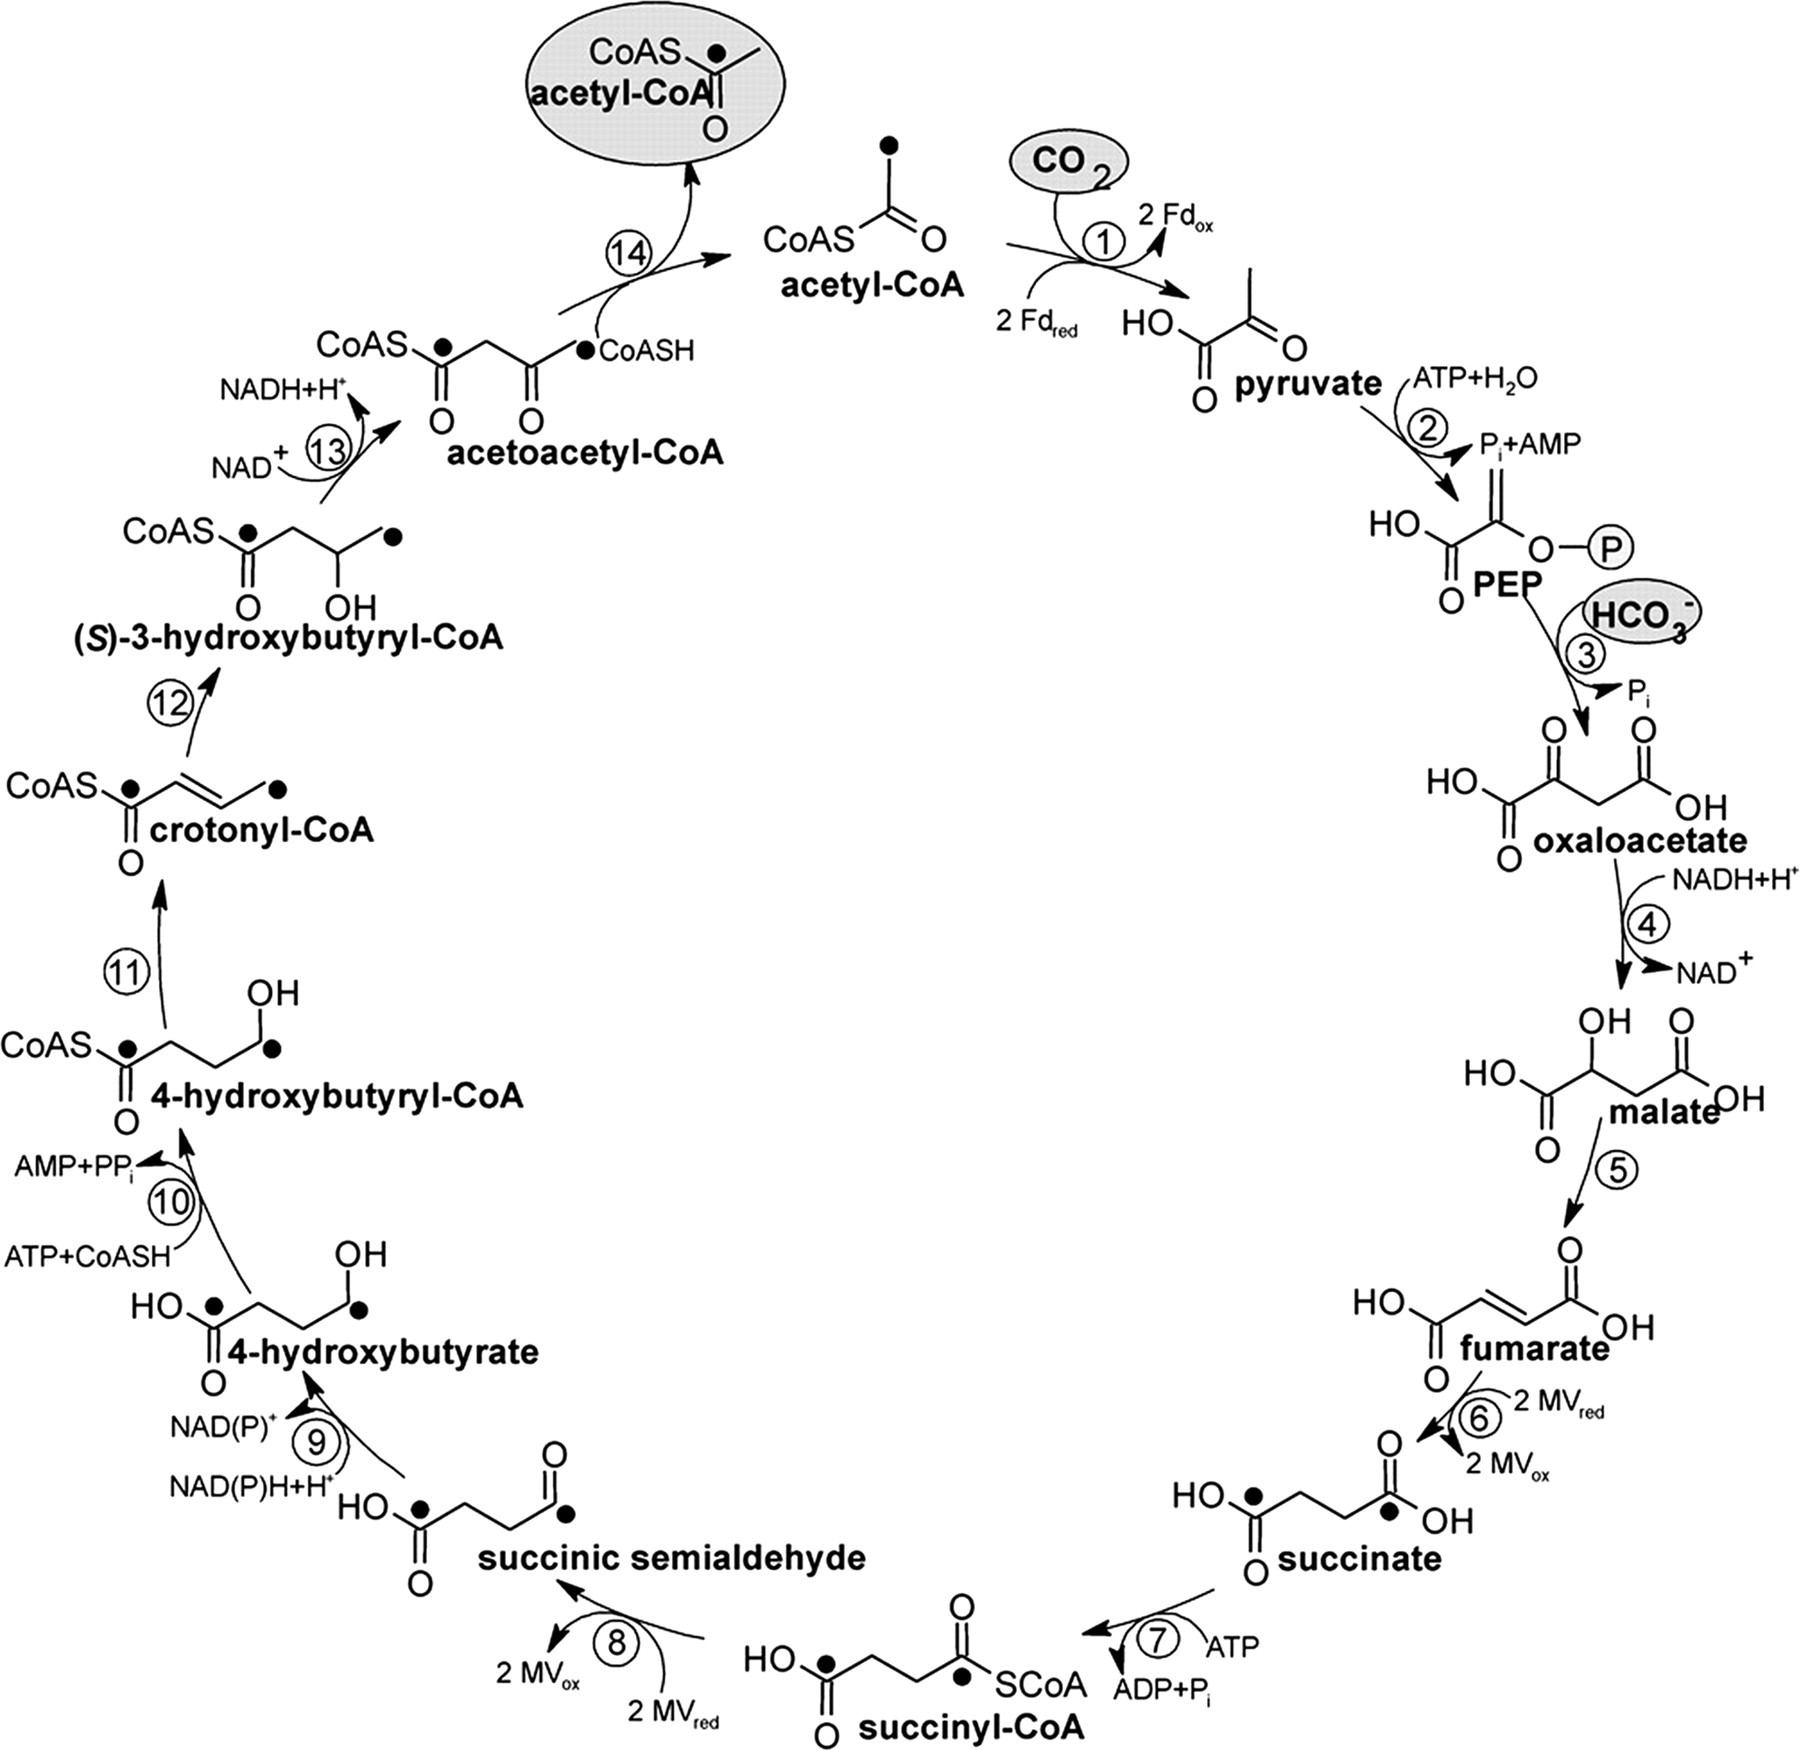
6.) "DC/4-HB cycle": Proposed dicarboxylate/4-hydroxybutyrate cycle for autotrophic CO2 fixation in Ignicoccus hospitalis, an anaerobic, autotrophic, hyperthermophilic Archaeum that serves as a host for the symbiotic/parasitic Archaeum Nanoarchaeum equitans. Enzymes: 1, pyruvate synthase (reduced MV); 2, pyruvate:water dikinase; 3, PEP carboxylase; 4, malate dehydrogenase (NADH); 5, fumarate hydratase; 6, fumarate reductase (reduced MV); 7, succinate thiokinase (ADP forming); 8, succinyl-CoA reductase (reduced MV); 9, succinate semialdehyde reductase (NADPH); 10, 4-hydroxybutyryl-CoA synthetase (AMP forming); 11, 4-hydroxybutyryl-CoA dehydratase; 12, crotonyl-CoA hydratase; 13, 3-hydroxybutyryl-CoA dehydrogenase (NAD+); 14, acetoacetyl-CoA β-ketothiolase. Label from [1,4-13C2] succinate is indicated by filled circles.
4.) "3-HP cycle": Proposed 3-hydroxypropionate cycle of autotrophic CO2 fixation in Chloroflexus aurantiacus. Enzyme 1, acetyl-CoA; 2, malonyl-CoA;3, 3-hydroxypropionate; 4, propionyl-CoA;5, methylmalonyl-CoA; 6, succinyl-CoA;7, malate; 8, malyl-CoA; 9, glyoxylate.
5.) "3-HP/4-HB cycle": Proposed autotrophic 3-hydroxypropionate/4-hydroxybutyrate cycle in Metallosphaera sedula. Reactions of the cycle are shown. Enzymes: 1, acetyl-CoA carboxylase; 2, malonyl-CoA reductase (NADPH); 3, malonate semialdehyde reductase (NADPH); 4, 3-hydroxypropionyl-CoA synthetase (AMP-forming); 5, 3-hydroxypropionyl-CoA dehydratase; 6, acryloyl-CoA reductase (NADPH); 7, propionyl-CoA carboxylase; 8, methylmalonyl-CoA epimerase; 9, methylmalonyl-CoA mutase; 10, succinyl-CoA reductase (NADPH); 11, succinate semialdehyde reductase (NADPH); 12, 4-hydroxybutyryl-CoA synthetase (AMP-forming); 13, 4-hydroxybutyryl-CoA dehydratase; 14, crotonyl-CoA hydratase; 15, 3-hydroxybutyryl-CoA dehydrogenase (NAD+); 16, acetoacetyl-CoA β-ketothiolase. The proposed pathway of glyceraldehyde 3-phosphate synthesis from acetyl-CoA and CO2 is also shown. Enzymes: 17, pyruvate synthase; 18, pyruvate, water dikinase [phosphoenolpyruvate (PEP) synthase]; 19, enolase; 20, phosphoglycerate mutase; 21, 3-phosphoglycerate kinase; 22, glyceraldehyde 3-phosphate dehydrogenase. The activities of pyruvate synthase and PEP synthase at 75°C were 10 to 25 nmol min–1 mg–1 protein and 25 nmol min–1 mg–1 protein, respectively.
6.) "DC/4-HB cycle": Proposed dicarboxylate/4-hydroxybutyrate cycle for autotrophic CO2 fixation in Ignicoccus hospitalis, an anaerobic, autotrophic, hyperthermophilic Archaeum that serves as a host for the symbiotic/parasitic Archaeum Nanoarchaeum equitans. Enzymes: 1, pyruvate synthase (reduced MV); 2, pyruvate:water dikinase; 3, PEP carboxylase; 4, malate dehydrogenase (NADH); 5, fumarate hydratase; 6, fumarate reductase (reduced MV); 7, succinate thiokinase (ADP forming); 8, succinyl-CoA reductase (reduced MV); 9, succinate semialdehyde reductase (NADPH); 10, 4-hydroxybutyryl-CoA synthetase (AMP forming); 11, 4-hydroxybutyryl-CoA dehydratase; 12, crotonyl-CoA hydratase; 13, 3-hydroxybutyryl-CoA dehydrogenase (NAD+); 14, acetoacetyl-CoA β-ketothiolase. Label from [1,4-13C2] succinate is indicated by filled circles.
6 CO2 fixation pathways found in nature summary: Figure 1: rPP, Figure 2: COMBINED reductive tricarboxylic acid ("rTCA"), 3-hydroxypropionate cycle "3-HP cycle", F3-hydroxypropionate/4-hydroxybutyratecycle "3-HP/4-HB cycle" and dicarboxylate/4-hydroxybutyrate cycle "DC/4-HB cycle", Figure 3: oxygen-sensitive reductive acetyl-CoA (rAcCoA) pathway:
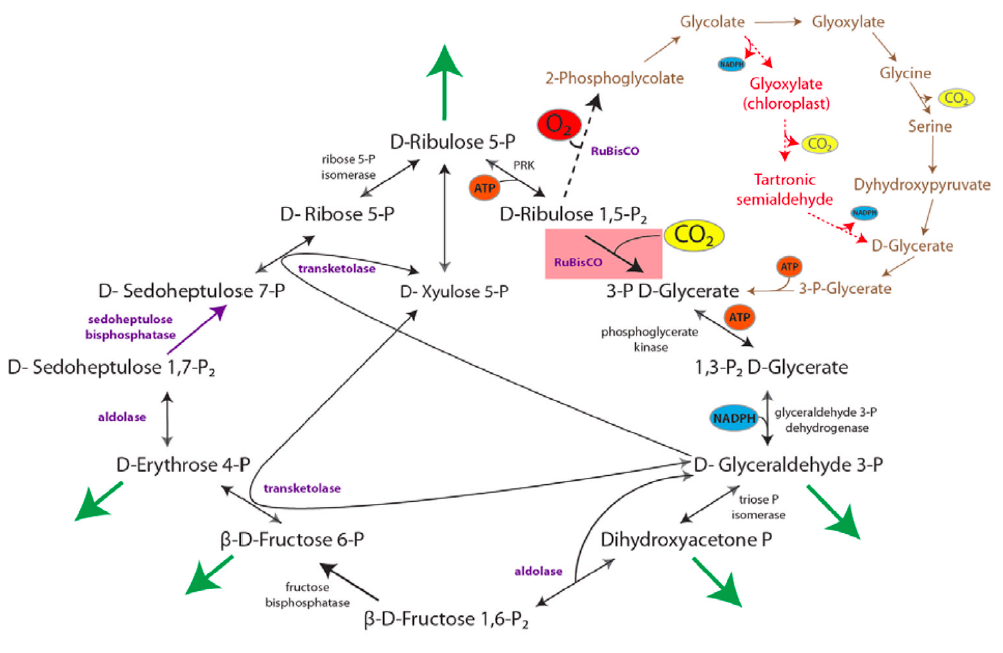
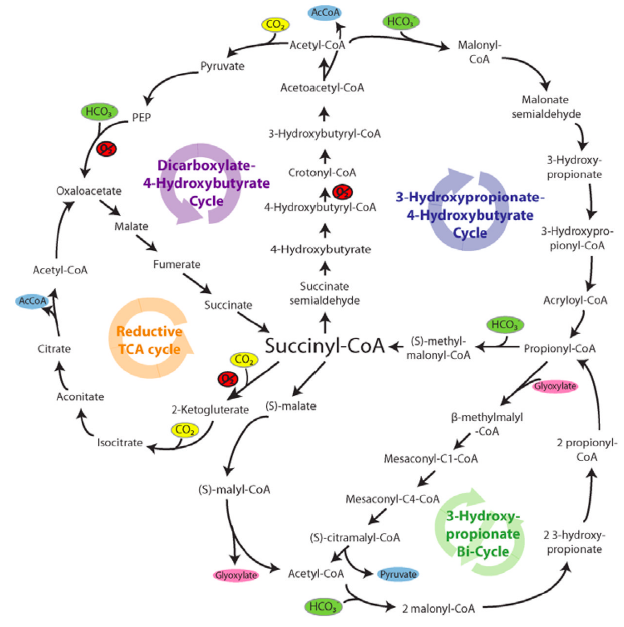

Figure 1 (left): rPP/Calvin cycle with regulation points: Inorganic carbon source (carbon dioxide) highlighted in yellow. Enzymes with known or suspected rate-limiting control over Calvin cycle activity under some natural conditions are shown in bold with purple text. The oxygenase reaction of RuBisCO is displayed (dashed arrow) and the canonical plant phosphoglycolate-processing photorespiratory pathway is shown in brown. Reactions requiring or generating ATP (orange circles) or NADPH (blue circles) are designated (although in some organisms, NADH may be substituted for NADPH in some reactions). Entry or exit of carbon dioxide (yellow circles) or oxygen (red) is denoted. Major exit points for intermediates of the Calvin cycle are designated by green arrows.
Figure 2 (middle): Schematic of the enzymes and intermediates of 4 of the 5 alternative (non-Calvin cycle), natural carbon fixation pathways utilized by autotrophic and chemolithotrophic microorganisms. All pathways use a common strategy of cycling between succinyl-CoA (center) and acetyl-CoA (circumference) in generate C2 or C3 carbon products which exit the cycle (shown in blue; acetyl-CoA, pyruvate). The carboxylating steps are indicated by the incorporation of carbon dioxide (yellow circles) or bicarbonate (green circles). Reactions requiring enzymes or co-factors with partial or complete oxygen sensitivity are indicated in red (O2), although some alternative oxygen-resistant enzymes exist for some of these reactions (see Table above).
Figure 3 (right): The 5th alternative natural carbon fixation pathway: the Wood-Ljungdahl pathway begins with the discovery of C. aceticum, the first isolated organism that was shown to grow by converting hydrogen gas and carbon dioxide to acetic acid. Unfortunately, this organism was “lost”, and the baton was passed to Moorella thermoacetica, which was named Clostridium thermoaceticum when it was isolated in 1942 and was so-called until fairly recently when the taxonomy of the genus Clostridium was revised. Thus, M. thermoacetica became the model acetogen, while C. aceticum hid from the scientific community for four decades, until G. Gottschalk, while visiting Barker’s laboratory, found an old test tube containing spores of the original C. aceticum strain and reactivated and reisolated this strain. Although M. thermoacetica did not reveal its potential to grow on H2 + CO2 until 1983, the recognition of a homoacetogenic fermentation of glucose, implied that it could use the reducing equivalents from glucose oxidation to convert CO2 to acetate.
Comparison of rPP/Calvin cycle to the 3-HP/4-HB cycle: The active “CO2” species is CO2 in the Calvin-Bassham-Benson cycle, whereas it is bicarbonate as cosubstrate for acetyl-CoA/propionyl-CoA carboxylase in the 3-hydroxypropionate/4-hydroxybutyrate cycle, with CO2 as cosubstrate for pyruvate synthase (see above). The turnover number (TON) of RuBisCO (average: 5 per second) reflects a low catalytic efficiency that requires large amounts of enzyme. M. sedula acetyl-CoA/propionyl-CoA carboxylase catalyzing both carboxylation reactions has a turnover number at 65°C of 28 per second (19). The Michaelis constant (Km) value of RuBisCO for dissolved CO2 [the average value is 0.05 mM, but it may be as high as 0.34 mM in some marine cyanobacteria (21)] is lower than or even comparable to the apparent Km value of archaeal acetyl-CoA/propionyl-CoA carboxylase for bicarbonate [0.3 mM (19)]. However, the CO2 concentration in water equilibrated with air (1 atm pressure, 20°C, 370 parts per million CO2) is 0.012 mM at pH 7.4 (which is the assumed intracellular pH), and the bicarbonate concentration under the same conditions is 0.26 mM. The concentration of bicarbonate will be even higher at pH 7.8 to 8.2 of seawater (apparent dissociation constant pKapp for CO2/HCO3– is 6.3, 20°C). Therefore, the acetyl-CoA carboxylase affinity for the active “CO2” species appears not to be inferior to that of RuBisCO. In addition, in volcanic gases and in animal hosts, the CO2 concentration is much higher than in ambient air. Although 4-hydroxybutyryl-CoA dehydratase is slowly inactivated by oxygen, it may be sufficiently stable at low oxygen tensions to maintain activity, especially in the protected environment of the cell. There is no additional clue from the genome as to how these Crenarchaeota protect one of their key enzymes of CO2 fixation from oxygen inactivation.
Source: Berg, I. A., Kockelkorn, D., Buckel, W., & Fuchs, G. (2007). A 3-hydroxypropionate/4-hydroxybutyrate autotrophic carbon dioxide assimilation pathway in Archaea. Science (New York, N.Y.), 318(5857), 1782–6. doi:10.1126/science.1149976
Source: Berg, I. A., Kockelkorn, D., Buckel, W., & Fuchs, G. (2007). A 3-hydroxypropionate/4-hydroxybutyrate autotrophic carbon dioxide assimilation pathway in Archaea. Science (New York, N.Y.), 318(5857), 1782–6. doi:10.1126/science.1149976
Theoretical/synthetic carbon fixation pathways:
The NADPH and ATP costs of all natural carbon fixation pathways are given in Table 1 above. The energetic cost of a pathway can be used to determine the energetic feasibility of the pathway as a whole, as well as of any of its parts. A thermodynamically favorable pathway is one for which the free energy change (∆Gr) associated with the production of one mole of product is negative. It is also required that a negative free energy change be obtained for each part of the pathway under the physiological range of metabolite concentrations.
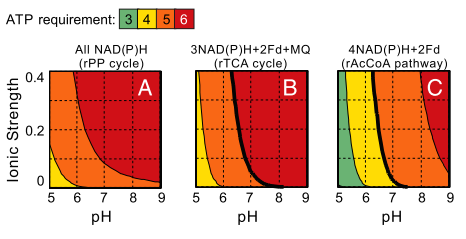
To ensure thermodynamic feasibility, a carbon fixation pathway must involve the hydrolysis of a certain minimal amount of ATP molecules. Yet, hydrolysis of more ATP molecules will decrease the energetic efficiency (i.e., increase the energetic cost). This minimal ATP requirement depends on the identity of the electron donors used by the pathway, as well as the pH and ionic strength. In the right figure, Bar-Even et al. analyze the minimal ATP requirement of the prevalent rPP pathway in physiological ionic strengths and pH values, where all of the electron donors are NAD(P)H and under ambient CO2 gas concentration of approximately 390 ppm. As part A shows, five to six ATPs are the minimal requirement. They note that the rPP uses nine ATPs to support carbon fixation under ambient conditions; the extra ATP molecules consumed are suggested to enhance the kinetics at the expense of ATP efficiency. Different electron donors, other than NAD(P)H, with lower (i.e., more energetic, e.g., ferredoxin) or higher (e.g., menaquinone) reduction potentials would shift this thermodynamic profile. Band C shows the minimal ATP requirement for the rAcCoA pathway and the rTCA cycle, which use these electron donors. Interestingly, although these pathways are potentially more efficient (hydrolyzing only four and five ATPs, respectively), we conclude that they are not feasible at pH values higher than 7 under ambient CO2 concentrations (bold lines correspond to the feasibility limits). These results are in agreement with the observation that organisms that operate the rTCA cycle or the rAcCoA pathway usually occupy high CO2 habitats or operate a carbon-concentrating mechanism (Figures below). These organisms are generally anaerobic and energy restricted compared to aerobes, which limits their available energy for investment in carbon fixation. This may explain the utilization the rTCA cycle or the rAcCOA pathway, which are more ATP-efficient than the rPP cycle.
To ensure thermodynamic feasibility, a carbon fixation pathway must involve the hydrolysis of a certain minimal amount of ATP molecules. Yet, hydrolysis of more ATP molecules will decrease the energetic efficiency (i.e., increase the energetic cost). This minimal ATP requirement depends on the identity of the electron donors used by the pathway, as well as the pH and ionic strength. In the right figure, Bar-Even et al. analyze the minimal ATP requirement of the prevalent rPP pathway in physiological ionic strengths and pH values, where all of the electron donors are NAD(P)H and under ambient CO2 gas concentration of approximately 390 ppm. As part A shows, five to six ATPs are the minimal requirement. They note that the rPP uses nine ATPs to support carbon fixation under ambient conditions; the extra ATP molecules consumed are suggested to enhance the kinetics at the expense of ATP efficiency. Different electron donors, other than NAD(P)H, with lower (i.e., more energetic, e.g., ferredoxin) or higher (e.g., menaquinone) reduction potentials would shift this thermodynamic profile. Band C shows the minimal ATP requirement for the rAcCoA pathway and the rTCA cycle, which use these electron donors. Interestingly, although these pathways are potentially more efficient (hydrolyzing only four and five ATPs, respectively), we conclude that they are not feasible at pH values higher than 7 under ambient CO2 concentrations (bold lines correspond to the feasibility limits). These results are in agreement with the observation that organisms that operate the rTCA cycle or the rAcCoA pathway usually occupy high CO2 habitats or operate a carbon-concentrating mechanism (Figures below). These organisms are generally anaerobic and energy restricted compared to aerobes, which limits their available energy for investment in carbon fixation. This may explain the utilization the rTCA cycle or the rAcCOA pathway, which are more ATP-efficient than the rPP cycle.
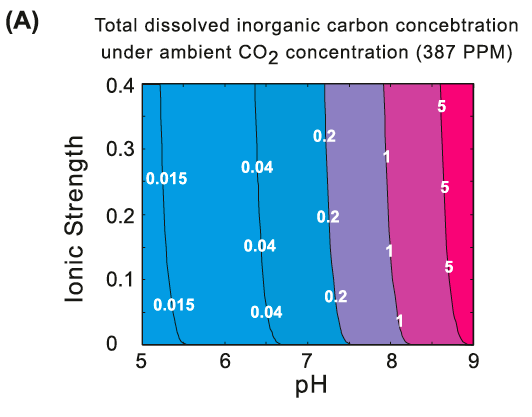
Thermodynamics of carbon fixation pathways. (A) Total dissolved inorganic carbon (CO2aq + HCO3- + CO32- + H2CO2aq) as a function of pH and ionic strength, under ambient CO2 (gas) concentration, 387ppm.
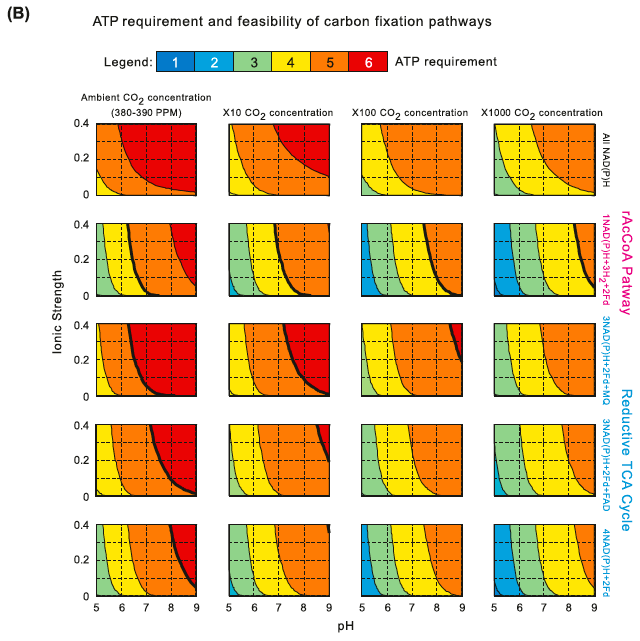
Minimal ATP requirement and feasibility of carbon fixation pathways. (B) The common product was assumed to be GA3P. Different electron donors schemes are contrasted as varying conditions of pH, ionic strength and CO2 (gas) concentrations. First row: all electron donors are NAD(P)H, as in the case of the reductive pentose phosphate pathway. Second row: Two of the electron pairs are donated by ferredoxins (Fd) and the other four by NAD(P)H, as in the case of the rAcCoA pathway. Third row: 2 of the electron pairs are donated by ferredoxins, 1 by menaquinone (MQ) and the other 3 by NAD(P)H, as in the case of the rTCA cycle, where menaquinone is the electron donor for fumarate reductase. Fourth row: 2 of the electron pairs are donated by ferredoxins, 1 by FAD and the other 3 by NAD(P)H, as in the case of the rTCA cycle, where FAD is the electron donor for fumarate
reductase. Fifth row: 2 of the electron pairs are donated by ferredoxins and the other 4 by NAD(P)H, as in the case of the rTCA cycle, where NADH is the direct electron donor for fumarate reductase. Columns correspond to different CO2 (gas) concentrations. Bold lines correspond to the feasibility ranges of the pathways: the pathways are not feasible at pH and ionic strength values corresponding to the area to the right of those lines.
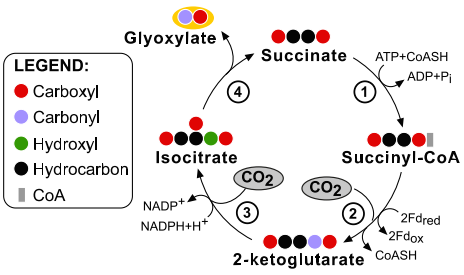
The simplest carbon fixation cycles: at bottom left the shortest possible carbon fixation cycle is depicted "KGS-ICDH". Two CO2 molecules are fixed to give glyoxylate, a two-carbon compound, as the cycle product. Every circle corresponds to a substituted carbon atom. This cycle is not thermodynamically feasible and does not represent a viable alternative for carbon fixation. Enzymes: 1, succinyl-CoA synthetase; 2, 2-ketoglutarate synthase; 3, isocitrate dehydroge- nase; and 4, isocitrate lyase.
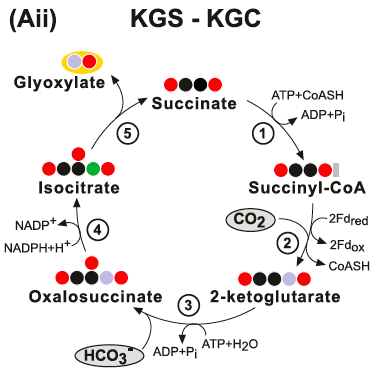
The KGS-KGC pathway is thermodynamically questionable - the free energy change associated with these cycles may be positive under a broad range of estimated physiological concentrations of their product. (Aii) The KGS-KGC cycle. Enzymes: (1) Succinyl-CoA Synthetase; (2) 2-Ketoglutarate Synthase; (3) 2-ketoglutarate carboxylase; (4) isocitrate:NADP oxidoreductase and (5) Isocitrate Lyase:
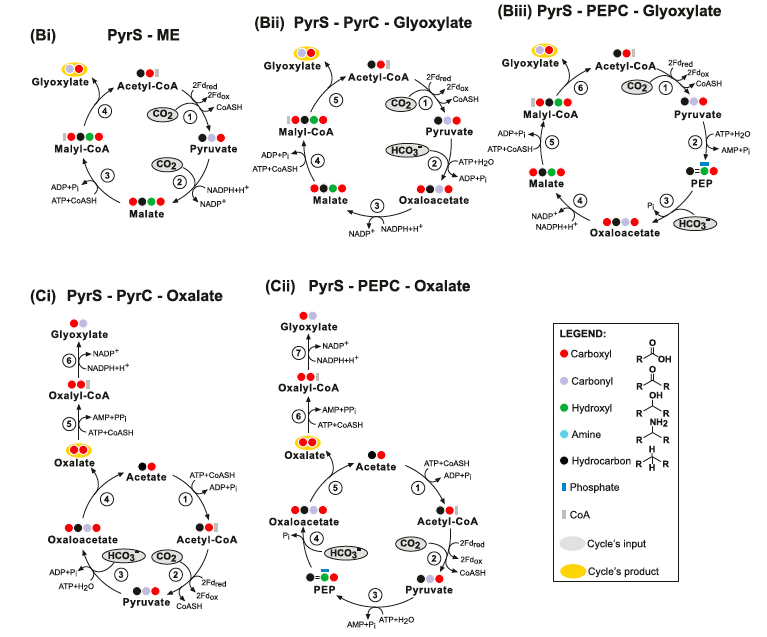
Other theoretical "simplest carbon fixation cycles" are depicted below: PyrS-ME pathways are not thermodynamically feasible because they contain a thermodynamic distributed bottleneck. PyrS-PyrC-Glyoxylate pathways are thermodynamically questionable: (Bii) The PyrS-PyrC-Glyoxylate cycle. Enzymes: (1) Pyruvate Synthase; (2) Pyruvate Carboxylate; (3) Malate Dehydrogenase; (4) Malyl-CoA Synthetase and (5) Malyl-CoA Lyase. (Bii) The PyrS-PEPC- Glyoxylate cycle. Enzymes: (1) Pyruvate Synthase; (2) Pyruvate Water (Phosphate) Dikinase; (3) PEP Carboxylate; (4) Malate Dehydrogenase; (5) Malyl-CoA Synthetase and (6) Malyl-CoA Lyase. (Ci) The PyrS-PyrC-Oxalate cycle. Enzymes: (1) Acetyl-CoA Synthetase; (2) Pyruvate Synthase; (3) Pyruvate Carboxylase; (4) Oxaloacetase; (5) Oxalyl-CoA Synthetase and (6) Glyoxylate Dehydrogenase (acylating). (Cii) The PyrS-PEPC-Oxalate cycle. Enzyme: (1) Acetyl-CoA Synthetase; (2) Pyruvate Synthase; (3) Pyruvate Water (Phosphate) Dikinases; (4) PEP Carboxylase; (5) Oxaloacetase; (6) Oxalyl-CoA Synthetase and (7) Glyoxylate Dehydrogenase (acylating):
Other theoretical/synthetic carbon fixation pathways:

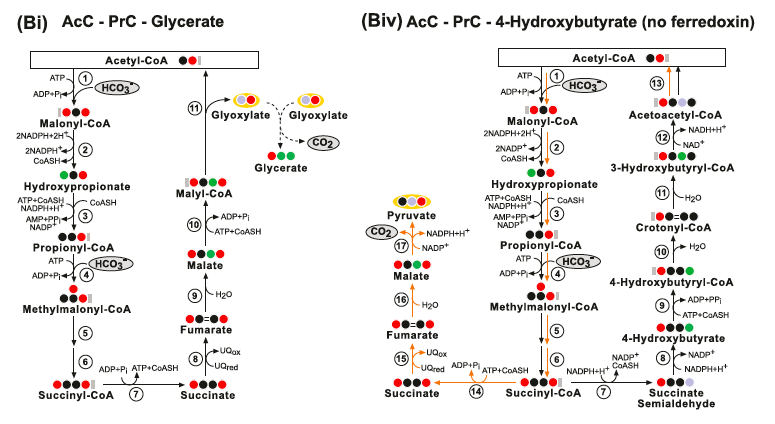
The AcC-PrC-Glycerate pathway. Enzymes: (1) Acetyl-CoA Carboxylase; (2) Malonyl-CoA Reductase; (3) Propionyl‐CoA synthase; (4) Propionyl-CoA Carboxylase; (5) Methylmalonyl-CoA Epimerase; (6) Methylmalonyl-CoA Mutase; (7) Succinyl-CoA Synthetase; (8) Succinate Dehydrogenase; (9) Fumarase; (10) Malyl-CoA Synthetase and (11) Malyl- CoA Lyase.
(Biv) The AcC-PrC-4-Hydrox- ybutyrate (no ferredoxin) pathway. Enzymes: (1) Acetyl-CoA Carboxylase; (2) Malonyl-CoA Reductase; (3) Propionyl‐CoA synthase; (4) Propionyl-CoA Car- boxylase; (5) Methylmalonyl-CoA Epimerase; (6) Methylmalonyl-CoA Mutase; (7) Succinyl-CoA Reductase; (8) 4-Hydroxybutyrate Dehydrogenase; (9)4- Hydroxybutyryl-CoA Synthetase; (10) 4-Hydroxybutyryl-CoA Dehydratase; (11) Enoyl-CoA Hydratase (Crotonase); (12) 3-Hydroxybutyryl-CoA Dehydrogenase; (13) Acetyl-CoA C-Acyltransferase; (14) Succinyl-CoA Synthetase; (15) Succinate Dehydrogenase; (16) Fumarate Hydratase and (17) Malic enzyme.
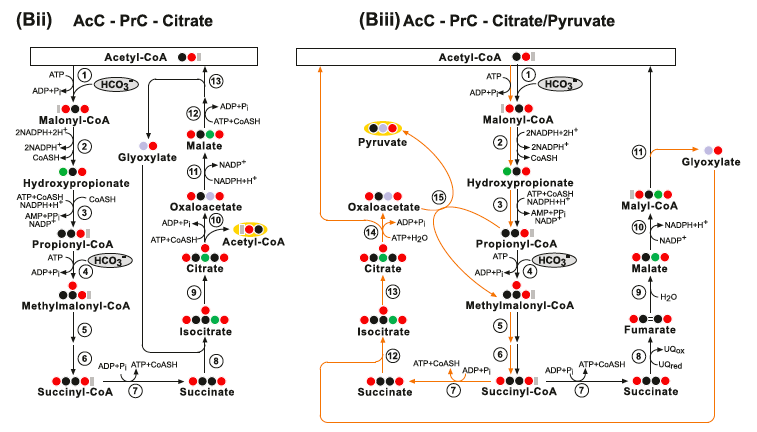
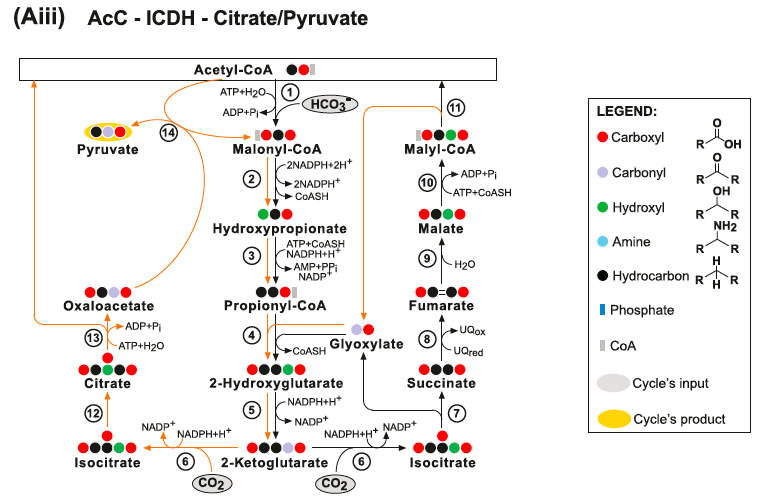
(Bii) The AcC-PrC-Citrate pathway. Enzymes: (1) Acetyl-CoA Carboxylase; (2) Malonyl-CoA Reductase; (3) Propionyl‐CoA synthase; (4) Propionyl-CoA Carboxylase; (5) Methylmalonyl-CoA Epimerase; (6) Methylmalonyl-CoA Mutase; (7) Succinyl-CoA Synthetase; (8) Isocitrate Lyase; (9) Aconitate Hydratase; (10) ATP Citrate Lyase; (11) Malate Dehydrogenase; (12) Malyl-CoA Synthetase and (13) Malyl-CoA Lyase. (Biii) The AcC-PrC-Citrate/Pyruvate pathway. Enzymes: (1) Acetyl-CoA Carboxylase; (2) Malonyl-CoA Reductase; (3) Propionyl‐CoA synthase; (4) Propionyl-CoA Carboxylase; (5) Methylmalonyl-CoA Epimerase; (6) Methylmalonyl-CoA Mutase; (7) Succinyl-CoA Synthetase; (8) Succinate Dehydrogenase; (9) Fumarate Hydratase; (10) Malyl-CoA Synthetase; (11) Malyl-CoA Lyase; (12) Isocitrate Lyase; (13) Aconitate Hydratase; (14) ATP Citrate Lyase and (15) Methylmalonyl-CoA Carboxytransferase.
Other theoretical/synthetic carbon fixation pathways - the Crotonyl-CoA pathways:


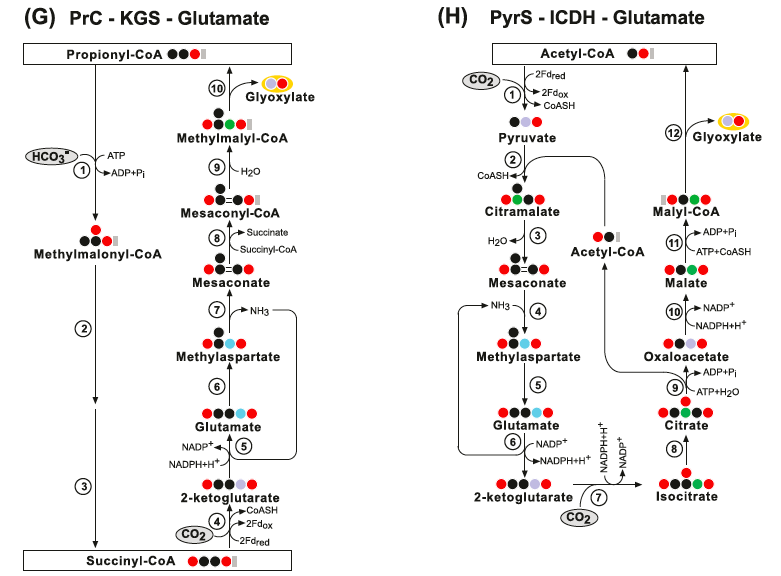
Other theoretical/synthetic carbon fixation pathways - the Glutamate pathways:

Other theoretical/synthetic carbon fixation pathways - the Threonine pathway:
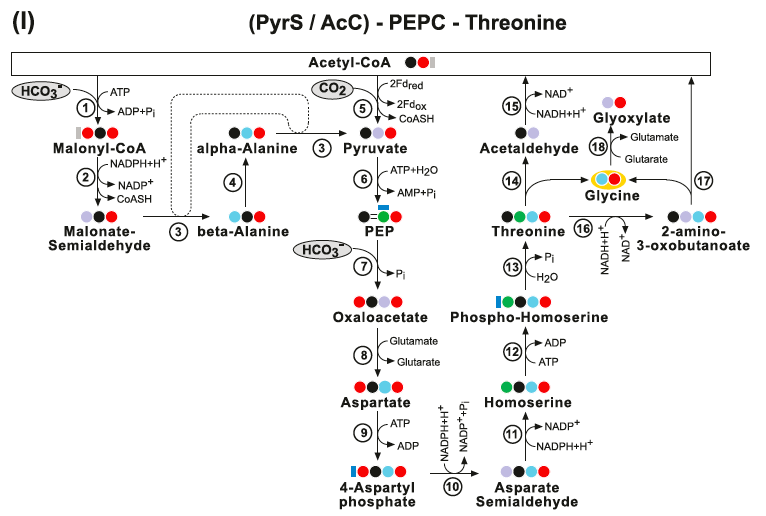
(I) The PyrS-PEPC-Threonine pathway and the AcC-PEPC-Threonine pathway. Enzymes: (1) Acetyl-CoA Carboxylase; (2) Malonate-Semialdehyde Dehydrogenase; (3) beta-Alanine-alpha-Alanine Transaminase; (4) Alanine Aminomutase; (5) Pyruvate Synthase; (6) Pyruvate Water (Phosphate) Dikinase; (7) PEP Carboxylase; (8) Aspartate Transaminase; (9) Aspartate Kinase; (10) Aspartate-Semialdehyde De- hydrogenase; (11) Homoserine Dehydrogenase; (12) Homoserine Kinase; (13) Threonine Synthase; (14) Threonine Aldolase; (15) Acetaldehyde Dehydrogenase (acetylating); (16) L-Threonine 3-Dehydrogenase; (17) Glycine C-Acetyltransferase and (18) Glycine Transaminase.
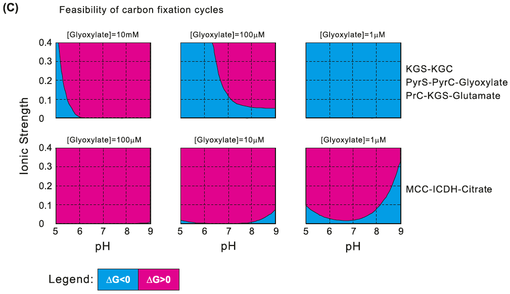
Feasibility of theoretical carbon fixation cycles: as separate metabolic units within the pathways, as function of pH, ionic strength and different concentrations of the cycles' product, glyoxylate. Blue represents the feasibility range (△G<0), while red corresponds to infeasibility of carbon fixation (△G>0). The upper boxes correspond to the ferredoxin-oxidoreductase pathways KGS-KGC, PyrS-PyrC-Glyoxylate and PrC-KGS-Glutamate. The bottom boxes correspond to the non-ferredoxin-oxidoreductase- containing pathway MCC-ICDH-Citrate.
Metabolic compatibility of the synthetic pathways: In designing alternative CO2 assimilation pathways, it is important to consider how the pathways will integrate into the endogenous metabolic network. The above data and tables were calculated using a model of central carbon metabolism in the algae Chlamydomonas (Manichaikul A, et al. (2009) Metabolic network analysis integrated with transcript verification for sequenced genomes. Nat Methods 6:589–592.) and employed constraint-based analysis [i.e., flux balance analysis and uniform random sampling (Schellenberger J, Palsson BO (2009) Use of randomized sampling for analysis of metabolic networks. J Biol Chem 284:5457–5461.)] to test the compatibility of each cycle with the endogenous metabolic network (Lewis NE, Jamshidi N, Thiele I, Palsson BO (2009) Metabolic Systems Biology: A Constraint-Based Approach. Encyclopedia of Complexity and Systems Science, ed Meyers RA (Springer, New York), pp 5535–5552.).
Bar-Even et al. also calculated the growth yield supported by each pathway as well as the number of significantly changed fluxes in the modified network compared with the WT model. Flux balance analysis (FBA) was used for determining a measure of the stoichiometric and topological efficiency of each cycle in the context of the Chlamydomonas metabolic network. FBA is a useful tool to compute growth yields and likely secretion products (Varma A & Palsson BO (1994) Stoichiometric flux balance models quantitatively predict growth and metabolic by-product secretion in wild-type Escherichia coli W3110. Appl Environ Microbiol 60(10):3724-3731.). For each cycle, FBA was used to compute these quantities given a constraint on the “committing reaction”. A “committing reaction”, by definition, is the reaction from the pathway of interest which connects the carbon flux in the pathway to the rest of the metabolic network. In each simulation, the committing reaction was constrained to a flux of 5 mmol carbon atoms per g Dry Weight biomass per hour. To compare the efficiency of different cycles, the FBA results were used to compute a molar ratio of secretion products to biomass production under a defined committing reaction flux (summarized in Table 1 above). Thereby, this measure allows the comparison of how efficiently the various cycles convert CO2 into biomass.
Limiting steps in CO2 fixation pathways are carboxylating enzymes. The theoretical design of kinetically efficient pathways requires the utilization of high-rate carboxylating enzymes, characterized by high specific activities and affinities toward CO2 or HCO3−. Bar-Even et al. performed a wide literature survey and compared kinetic properties of known carboxylating enzymes (Tables above). Phosphoenolpyruvate (PEP) carboxylase and pyruvate carboxylase are the most favorable carboxylating enzymes; both have high specific activities and superior affinity toward HCO3−. Acetyl-CoA and propionyl-CoA carboxylases follow as the next favorable enzymes. Isocitrate dehydrogenase, which shows a preference for decarboxylation under common physiological conditions (in contrast to the previous options), is also a kinetically acceptable option. All other carboxylating enzymes are rather slow under ambient CO2/HCO3− concentrations (specific activity, <2 μmol/min/mg). Using a systematic search tool to find the shortest pathways that employ different sets of the favorable carboxylating enzymes Bar-Even et al. numerically predicted which of these pathways has the highest pathway specific activity.
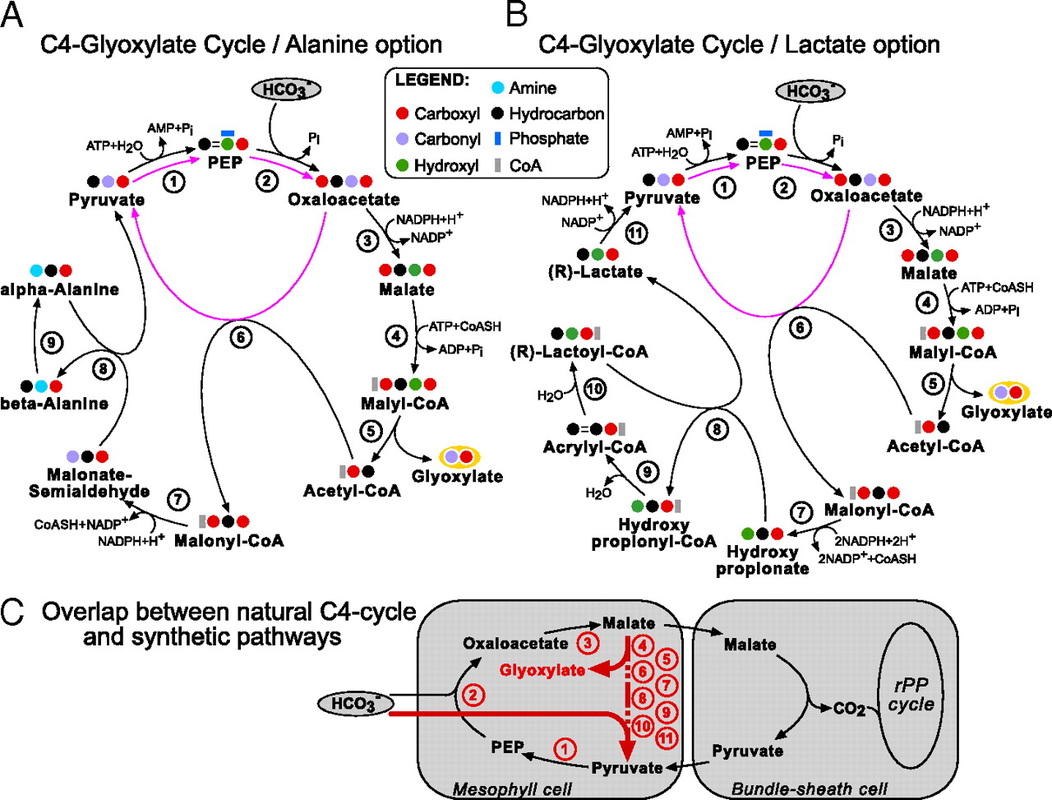
The product of those cycles, glyoxylate, is assimilated by the bacterial-like glycerate pathway. This family of pathways has been termed the malonyl-CoA-oxaloacetate-glyoxylate (MOG) pathways. It was observed that the MOG pathways have a two- to threefold higher pathway specific activity compared with the rPP cycle (Table above). Figures A and B present two MOG pathways that employ only one carboxylating enzyme, the superior PEP carboxylase. These MOG pathways were then renamed as the C4-glyoxylate cycles, because they overlap with the naturally evolved C4 mechanism. In C4 plants, carbon is temporarily fixed in the mesophyll cells, by the carboxylation of PEP to oxaloacetate. This is followed by the reduction of oxaloacetate to malate. Malate is then transported to the bundle-sheath cells, where it releases the CO2, which is reassimilated by Rubisco. Pyruvate is recycled to complete the cycle which serves as a “futile cycle” that concentrates CO2. All these reactions, with the exception of the last step of decarboxylation, appear in the C4-glyoxylate cycle. Therefore, the C4-glyoxylate cycles are an alternative for completing the C4 cycle without “losing” the carbon: replacing the “futile” decarboxylation reaction with an extra carboxylation, accompanied by the export of glyoxylate (C).
The product of those cycles, glyoxylate, is assimilated by the bacterial-like glycerate pathway. This family of pathways has been termed the malonyl-CoA-oxaloacetate-glyoxylate (MOG) pathways. It was observed that the MOG pathways have a two- to threefold higher pathway specific activity compared with the rPP cycle (Table above). Figures A and B present two MOG pathways that employ only one carboxylating enzyme, the superior PEP carboxylase. These MOG pathways were then renamed as the C4-glyoxylate cycles, because they overlap with the naturally evolved C4 mechanism. In C4 plants, carbon is temporarily fixed in the mesophyll cells, by the carboxylation of PEP to oxaloacetate. This is followed by the reduction of oxaloacetate to malate. Malate is then transported to the bundle-sheath cells, where it releases the CO2, which is reassimilated by Rubisco. Pyruvate is recycled to complete the cycle which serves as a “futile cycle” that concentrates CO2. All these reactions, with the exception of the last step of decarboxylation, appear in the C4-glyoxylate cycle. Therefore, the C4-glyoxylate cycles are an alternative for completing the C4 cycle without “losing” the carbon: replacing the “futile” decarboxylation reaction with an extra carboxylation, accompanied by the export of glyoxylate (C).
Notably, it has been found that all the pathways with the highest specific activities employ similar cycles or pathways, with a shared metabolic core structure: the core of the most promising carbon fixation pathways family and its modules are modeled below: The metabolic blueprint of the MOG pathways alongside different metabolic alternatives they can employ: (The enzymes lactoyl-CoA dehydratase and alanine 2,3-aminomutase, however, present several difficulties).
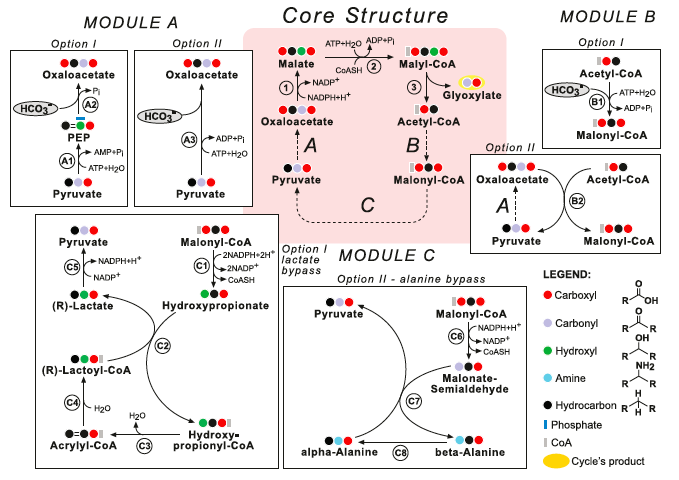
Enzymes of the core structure: (1) Malate Dehydrogenase; (2) Malyl-CoA Synthetase and (3) Malyl-CoA Lyase. Module A: (A1) Pyruvate Water (Phosphate) Dikinase; (A2) PEP Carboxylase and (A3) Pyruvate Carboxylase. Module B: (B1) Acetyl-CoA Carboxylase and (B2) Methyl- malonyl-CoA Carboxytransferase. Module C: (C1) Malonyl-CoA Reductase (3-hydroxypropionate forming); (B2) Propionate CoA Transferase; (B3) Enoyl-CoA Hydratase; (C4) Lactoyl-CoA Dehydratase; (C5) Lactate Dehydrogenase; (C6) Malonate-semialdehyde dehydrogenase; (C7) beta-Alanine-Pyruvate Transaminase and (C8) Alanine 2,3-Aminomutase.
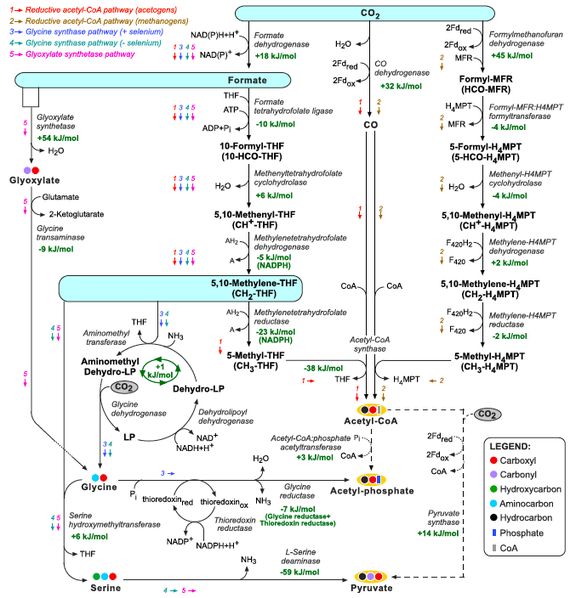
Interestingly, the metabolic pathways used by methylotrophic organisms to assimilate reduced C1 compounds to central metabolism (Lidstrom, 2006; Seo et al., 2007), can potentially be employed for autotrophic CO2 assimilation. The ribulose monophosphate pathway and the xylulose 5-phosphate cycle assimilate free formaldehyde while the serine pathway assimilates formaldehyde while being attached to THF (5,10-methylene-THF) (Lidstrom, 2006; Seo et al., 2007). Some chemolithotrophic or phototrophic organisms can directly reduce CO2 to formate, attach it to THF and reduce it to 5,10-methylene-THF, enabling carbon fixation through the serine pathway. Since 5,10-methylene-THF and its derivatives can be enzymatically or spontaneously cleaved to produce formaldehyde (Kallen and Jencks, 1966), the ribulose monophosphate pathway and the xylulose 5-phosphate cycle can also serve as effective CO2 fixation pathways.
Figure: THF corresponds to tetrahydrofolate, MPT to methanopterin, MFR to methanofuran, and F420 to reduced deazaflavin factor 420. The glycine cleavage system is composed of the enzymes glycine dehydrogenase, aminomethyltransferase, and dehydrolipoyl dehydrogenase. ‘LP’ corresponds to lipoyl-protein (H-protein of the glycine cleavage system). Changes in Gibbs energy, Gr’, at pH 7, ionic strength of 0.1 M, and reactant concentrations of 1 mM are shown in green and were calculated using eQuilibrator (http://equilibrator.weizmann.ac.il; Flamholz et al., 2011) and available experimental Gibbs energies of formation, Gf’, from Alberty (2003). Changes in Gibbs energy for reactions involving THF, MFR, and MPT were taken from Maden (2000). Change in Gibbs energy for the glycine synthase system is taken from Liegel (1985).
Figure: THF corresponds to tetrahydrofolate, MPT to methanopterin, MFR to methanofuran, and F420 to reduced deazaflavin factor 420. The glycine cleavage system is composed of the enzymes glycine dehydrogenase, aminomethyltransferase, and dehydrolipoyl dehydrogenase. ‘LP’ corresponds to lipoyl-protein (H-protein of the glycine cleavage system). Changes in Gibbs energy, Gr’, at pH 7, ionic strength of 0.1 M, and reactant concentrations of 1 mM are shown in green and were calculated using eQuilibrator (http://equilibrator.weizmann.ac.il; Flamholz et al., 2011) and available experimental Gibbs energies of formation, Gf’, from Alberty (2003). Changes in Gibbs energy for reactions involving THF, MFR, and MPT were taken from Maden (2000). Change in Gibbs energy for the glycine synthase system is taken from Liegel (1985).
Implementing the Synthetic Carbon Fixation Pathways: The MOG pathways are the most promising synthetic carbon fixation pathways. This is because of the unique use of the best carboxylating enzyme, PEP carboxylase. The in vivo implementation and assimilation of the proposed synthetic carbon fixation pathways in photoautotrophs will certainly involve numerous difficulties. The assimilation of the foreign pathway can be regarded as a “metabolic heart transplant,” which the host cell may well reject. The most imminent problems may arise from negative interactions of the pathway with the endogenous metabolic network of the host, non-optimal expression, activity and stability of the recombinant proteins, and erroneous regulation and localization. However, by forcing the use of these alternative pathways as the sole option for growth, natural selection might be harnessed to overcome these obstacles. A genetically modified photosynthetic organism might not have a selective advantage in nature, but may hold great promise from a biotechnological point of view, increasing crop yields under controlled and optimized agricultural conditions. It must be noted that these predictions and analyses were performed for static environmental conditions. One of the future challenges is to incorporate the effect of fluctuations in, for example, temperatures, water availability, and CO2 concentration into the modeling frameworks.
Switching the carbon fixation pathway of a plant or alga can potentially increase its productivity under specific desirable conditions. Also, adopting a biotechnologically important heterotrophic microbe, such as E. coli or S. cerevisiae, to an autotrophic mode of growth is a promising venue for the production of various commodities without the need of costly feedstock which compete with human and animal consumption (DOE, 2011; Hawkins et al., 2011). In all of these cases, it is important to pick the right carbon fixation pathway for the host. In choosing a suitable pathway one should consider, for example, the following aspects: (i) Does the oxygen tolerance of the pathway suit the intended cultiva- tion conditions? (ii) Does the ATP requirement of the pathway fit the expected cellular energy influx? (iii) Does the expected kinetics of the pathway coincide with the desirable growth rate? (iv) Does the structure of the pathway integrate well with the endogenous metabolic network? (v) Do the optimal temperatures of the enzymes participating in the chosen pathway fit the intended cultivation temperature? Regardless of the reason for which one is interested in carbon fixation, whether it is purely scientific or biotechno- logical, many more interesting discoveries can still be expected in the years to come. The repertoire of carbon fixation pathways currently known is expected to grow as more organisms are cultivated, sequenced, and biochemically analysed, so it may well be possible to build a more comprehensive picture of the design principles of carbon fixation pathways.
Switching the carbon fixation pathway of a plant or alga can potentially increase its productivity under specific desirable conditions. Also, adopting a biotechnologically important heterotrophic microbe, such as E. coli or S. cerevisiae, to an autotrophic mode of growth is a promising venue for the production of various commodities without the need of costly feedstock which compete with human and animal consumption (DOE, 2011; Hawkins et al., 2011). In all of these cases, it is important to pick the right carbon fixation pathway for the host. In choosing a suitable pathway one should consider, for example, the following aspects: (i) Does the oxygen tolerance of the pathway suit the intended cultiva- tion conditions? (ii) Does the ATP requirement of the pathway fit the expected cellular energy influx? (iii) Does the expected kinetics of the pathway coincide with the desirable growth rate? (iv) Does the structure of the pathway integrate well with the endogenous metabolic network? (v) Do the optimal temperatures of the enzymes participating in the chosen pathway fit the intended cultivation temperature? Regardless of the reason for which one is interested in carbon fixation, whether it is purely scientific or biotechno- logical, many more interesting discoveries can still be expected in the years to come. The repertoire of carbon fixation pathways currently known is expected to grow as more organisms are cultivated, sequenced, and biochemically analysed, so it may well be possible to build a more comprehensive picture of the design principles of carbon fixation pathways.
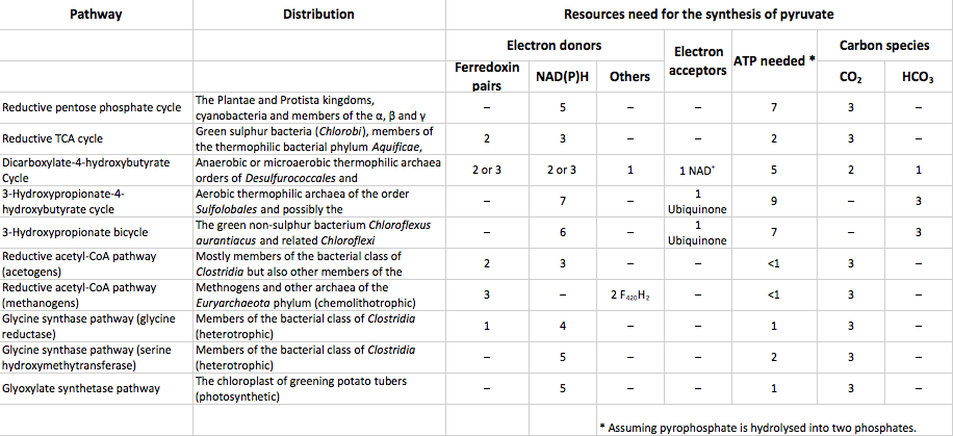
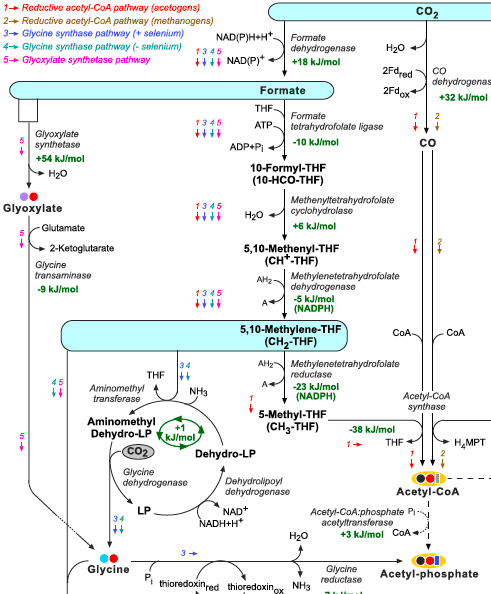
A good example for multi-functionality of a carbon fixation pathway is the reductive acetyl-CoA pathway (left Figure, pathway 1) which is employed both heterotrophi- cally and autotrophically (Drake et al., 2006, 2008; Ragsdale, 2008; Ragsdale and Pierce, 2008). The acetogenic bacterium Moorella thermoacetica, for example, can use this pathway to convert glucose into three molecules of acetate (Fontaine et al., 1942; Collins et al., 1994): two acetate molecules are formed directly from the glycolytic fermenta- tion of glucose while the third is produced by the reductive acetyl-CoA pathway, which recycles the reducing equivalents produced in the fermentation process. Notably, this metabolic alternative enables the production of four ATP molecules instead of the two normally produced in glycolysis. Usually, in order to recycle the reduced electron carriers, acetyl-CoA molecules formed in glycolysis are reduced to acetaldehyde and then to ethanol. However, in heterotrophic organisms that use the reductive acetyl-CoA pathway, the reduced electron carriers are recycled through carbon fixation, freeing acetyl-CoA molecules to be converted into acetyl-phosphate. Acetyl-phosphate then transfers its phosphate groups to ADP, forming acetate and ATP and thereby increasing the ATP yield by two extra molecules per glucose (Drake, 1994). This route represents the highest known ATP yield in fermentation. The reductive acetyl-CoA pathway is also the only autotrophic carbon fixation pathway that can be used for energy conservation. The product of the pathway, acetyl- CoA, can be converted to acetate via acetyl-phosphate and provide an ATP that recoups the ATP-dependent linkage of formate and tetrahydrofolate.
Acetogens are organisms that utilize the acetyl-CoA pathway for 1.) a mechanism for the reductive synthesis of acetyl-CoA from CO2, 2.) terminal electron-accepting, energy-conserving process and 3.) mechanism for the fixation of CO2 in the synthesis of cell carbon. e.g. Eubacterium limosum forms butyrate from acetyl-CoA or Acetobacterium woodii froms ethanol from acetyl-CoA under certain conditions.
Acetogens are organisms that utilize the acetyl-CoA pathway for 1.) a mechanism for the reductive synthesis of acetyl-CoA from CO2, 2.) terminal electron-accepting, energy-conserving process and 3.) mechanism for the fixation of CO2 in the synthesis of cell carbon. e.g. Eubacterium limosum forms butyrate from acetyl-CoA or Acetobacterium woodii froms ethanol from acetyl-CoA under certain conditions.
CO2 conversion to Formate - Syngas fermentation - Formate as fuel and H2 storage option:
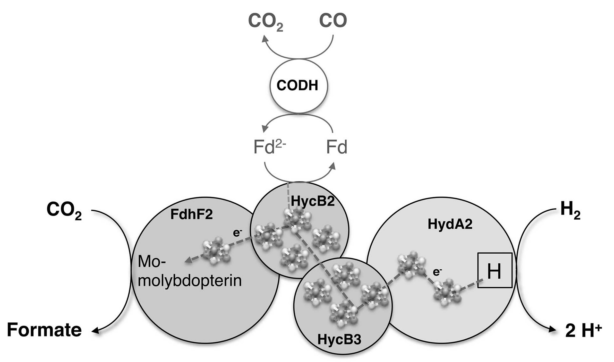
Schuchmann and Müller [17] recently reported the discovery of a bacterial hydrogen-dependent carbon dioxide reductase (HDCR) that directly uses dihydrogen for the interconversion of CO2 to formate from the acetogenic bacterium Acetobacterium woodii. They targeted this bacterium because it grows with H2+CO2 at ambient conditions using an ancient (archaeal, rTCA) pathway for energy conservation. It lives under extreme energy limitation, and a direct use of H2 for CO2 reduction would be beneficial for the cell. Moreover, an HDCR was predicted from the genome sequence.
The genome of A. woodii also encodes for a carboanhydrase that allows the rapid interconversion of CO2 and HCO3–. During incubations of up to 0.45M HCO3– the final formate concentration increased with increasing substrate concentration. At 1 × 10e5 Pa H2, the thermodynamic equilibrium was reached (i.e. [HCO3–]=[HCOO–]). Indeed, up to 0.45M HCO3– the final formate concentration fits well to the theoretic thermodynamic limit of the reaction, underlining the independence of the carboxylation of CO2/HCO3- from other cellular processes.
Acetogenic bacteria such as A. woodii are also able to use syngas, a mixture of H2, CO2, and CO, as substrate for acetogenesis. Syngas fermentation is an increasingly considered “green” option for the production of chemicals because it can be produced from gasification of wastes or biomass and is thus considered a renewable energy source. A similar gene cluster was predicted in the acetogen Treponema primitia. HDCR-type enzymes are not re- stricted to acetogens, but they have also proposed functions in sulfate reducing organisms and in syntrophic associations.
No enzyme is known to catalyze the direct hydrogenation of CO2 alone. One isolated formate dehydrogenase (FDH) could be shown to reduce CO2 electrochemically, but not with H2 as the electron donor: Reda et al. [18] demonstrate a reversible interconversion of carbon dioxide and formate by an electroactive enzyme: a tungsten-containing formate dehydrogenase enzyme (FDH1) adsorbed to an electrode surface catalyzes the efficient electrochemical reduction of CO2 to formate:

Electrocatalysis by FDH1 is thermodynamically reversible - only small overpotentials are required, and the point of zero net catalytic current defines the reduction potential. It occurs under thoroughly mild conditions, and formate is the only product. Both as a homogeneous catalyst and on the electrode, FDH1 catalyzes CO2 reduction with a rate more than two orders of magnitude faster than that of any known catalyst for the same reaction.
Formate dehydrogenases are enzymes that catalyze the oxidation of formate to CO2. The most common class catalyze the direct transfer of a hydride moiety from formate to NAD(P)+, but it is difficult to drive them in reverse because the reduction potential of NAD(P)+ is more positive than that of CO2 (usually formate oxidation in general is more than five times faster than CO2 reduction).
In some prokaryotes, however, the formate dehydrogenases are complex enzymes that contain molybdenum or tungsten cofactors to transfer the electrons from formate oxidation to an independent active site, to reduce quinone, protons, or NAD(P)+. These enzymes are suitable for adsorption onto an electrode, so that the electrode accepts the electrons from formate oxidation, and it may also donate electrons and drive CO2 reduction. Therefore, they are potential electrocatalysts for the reduction of CO2.
Tungstoenzymes catalyze low-potential reactions, so tungsten-containing formate dehydrogenases [in which the tungsten is coordinated by two pyranopterin guanosine dinucleotide cofactors and a selenocysteine] are those most associated with CO2 reduction. FDH1 is a tungsten-containing formate dehydrogenases from Syntrophobacter fumaroxidans, an anaerobic bacterium that oxidizes propionate to acetate, CO2, and six reducing equivalents. The reducing equivalents are used to reduce protons to hydrogen or to reduce CO2 to formate. During syntrophic growth S. fumaroxidans optimizes its metabolism by transferring the formate (and/or the hydrogen) to its syntrophic partner. Therefore, the tungsten-containing formate dehydrogenases of S. fumaroxidans must be both thermodynamically and kinetically efficient, and so they are good candidate electrocatalysts for the electrochemical reduction of CO2.
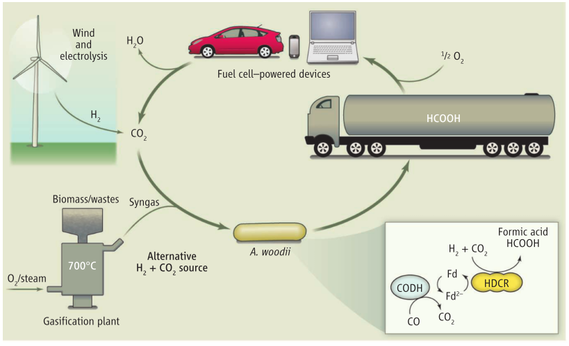
Electricity is increasingly produced from renewable sources, but it remains difficult to store electric power at a large scale. Hydrogen is a strong candidate for energy storage, but there is still no safe, economically viable, and reasonably sized solution to store and transport it. The use of a liquid chemical hydrogen carrier with a high H2 content per unit of mass and a good safety profile may solve this problem. For example, hydrogen may be safely stored by reducing carbon dioxide (CO2) to formic acid, a liquid source with a much higher energy density than H2. Biological systems also use formate as a chemical equivalent of H2 [19-22].
Rice et al. [23] report the performance of formic acid fuel oxidation on a solid PEM fuel cell at 60°C and found that formic acid is an excellent fuel for a model fuel cell, using a proprietary anode catalyst produced currents up to 134 mA/cm2 and power outputs up to 48.8 mW/cm2. Open circuit potentials (OCPs) are about 0.72 V. The fuel cell runs successfully over formic acid concentrations between 5 and 20M with little crossover or degradation in performance. The anodic polarization potential of formic acid is approximately 0.1 V lower than that for methanol on a standard Pt/Ru catalyst.
Kjeang et al. [24] describe an alkaline microfluidic fuel cell with an alkaline version of a formic acid anode and a sodium hypochlorite cathode. Both sodium formate fuel and sodium hypochlorite oxidant are used as highly concentrated solutions, thereby facilitating fuel cell systems with high overall energy density. Sodium hypochlorite is commonly available as hypochlorite bleach. The alkaline anodic half-cell produces carbonate rather than the less-desirable gaseous CO2, while sustaining the rapid kinetics associated with formic acid oxidation in acidic media. Both half-cells provide high current densities at relatively low overpotentials and are free of gaseous products that may otherwise limit microfluidic fuel cell performance. The microfluidic fuel cell takes advantage of a recently developed membraneless architecture with flow-through porous electrodes. Power densities up to 52 mW/cm2 and overall energy conversion efficiencies up to 30% per single pass are demonstrated at room temperature using 1.2M formate fuel and 0.67M hypochlorite oxidant. The alkaline formate/hypochlorite fuel and oxidant combination demonstrated here, or either one of its individual half-cells, may also be useful in conventional membrane-based fuel cell designs. These results show that formic acid fuel cells are attractive alternatives for small portable fuel cell applications.
Limited practical application of exogenous carbon-fixation pathways has been employed in cyanobacteria, with the possible exception of Synechococcus engineered by Joule Unlimited [25].
- Spreitzer, R.J. and Salvucci, M.E. (2002) Rubisco: structure, regulatory interactions, and possibilities for a better enzyme. Annu. Rev. Plant Biol. 53, 449–475
- Andersson, I. and Taylor, T.C. (2003) Structural framework for catalysis and regulation in ribulose-1,5-bisphosphate carboxylase/ oxygenase. Arch. Biochem. Biophys. 414, 130–140, Parry, M.A. et al. (2003)
- Manipulation of Rubisco: the amount, activity, function and regulation. J. Exp. Bot. 54, 1321–1333
- Zhu, X.G. et al. (2010) Improving photosynthetic efficiency for greater yield. Annu. Rev. Plant Biol. 61, 235–261
- Atsumi, S. et al. (2009) Direct photosynthetic recycling of carbon dioxide to isobutyraldehyde. Nat. Biotechnol. 27, 1177–1180
- Marcus, Y. et al. (2008) Does Rubisco limit the rate of photosynthesis? In Photosynthesis. Energy from the Sun (Allen, J.F. et al., eds), pp. 863– 866, Springer Netherlands
- Petit, J.R. et al. (1999) Climate and atmospheric history of the past 420,000 years fromtheVostok ice core, Antarctica. Nature 399, 429–436
- Zhu, X.G. et al. (2004) Would transformation of C3 crop plants with foreign Rubisco increase productivity? A computational analysis extrapolating from kinetic properties to canopy photosynthesis. Plant Cell Environ. 27, 155–165
- Berg, I.A. et al. (2010) Autotrophic carbon fixation in archaea. Nat. Rev. Micro. 8, 447–460
- Bar-Even, A. et al. (2010) Design and analysis of synthetic carbon fixation pathways. Proc. Natl. Acad. Sci. U.S.A. 107, 8889–8894
- Kebeish, R., Niessen, M., Thiruveedhi, K., Bari, R., Hirsch, H.-J., Rosenkranz, R., … Peterhänsel, C. (2007). Chloroplastic photorespiratory bypass increases photosynthesis and biomass production in Arabidopsis thaliana. Nature Biotechnology, 25(5), 593–9. doi:10.1038/nbt1299
- Evans MC, Buchanan BB, Arnon DI (1966) A new ferredoxin-dependent carbon reduction cycle in a photosynthetic bacterium. Proc Natl Acad Sci USA 55:928–934.
- Ragsdale SW, Pierce E (2008) Acetogenesis and the Wood-Ljungdahl pathway of CO(2) fixation. Biochim Biophys Acta 1784:1873–1898.
- Herter S, Fuchs G, Bacher A, Eisenreich W (2002) A bicyclic autotrophic CO2 fixation pathway in Chloroflexus aurantiacus. J Biol Chem 277:20277–20283.
- BergI A, Kockelkorn D, Buckel W, Fuchs G (2007) A3-hydroxypropionate/4-hydroxybutyrate autotrophic carbon dioxide assimilation pathway in Archaea. Science 318:1782–1786.
- Huber H, et al. (2008) A dicarboxylate/4-hydroxybutyrate autotrophic carbon assimilation cycle in the hyperthermophilic Archaeum Ignicoccus hospitalis. Proc Natl Acad Sci USA 105: 7851–7856.
- Schuchmann, K., & Muller, V. (2013). Direct and Reversible Hydrogenation of CO2 to Formate by a Bacterial Carbon Dioxide Reductase. Science, 342(6164), 1382–1385. doi:10.1126/science.1244758
- Reda, T., Plugge, C. M., Abram, N. J., & Hirst, J. (2008). Reversible interconversion of carbon dioxide and formate by an electroactive enzyme. Proceedings of the National Academy of Sciences of the United States of America, 105(31), 10654–8. doi:10.1073/pnas.0801290105
- Da Silva, S. M., Voordouw, J., Leitão, C., Martins, M., Voordouw, G., & Pereira, I. A. C. (2013). Function of formate dehydrogenases in Desulfovibrio vulgaris Hildenborough energy metabolism. Microbiology (Reading, England), 159(Pt 8), 1760–9. doi:10.1099/mic.0.067868-0
- Crable, B. R., Plugge, C. M., McInerney, M. J., & Stams, A. J. M. (2011). Formate formation and formate conversion in biological fuels production. Enzyme Research, 2011, 532536. doi:10.4061/2011/532536
- Enthaler, S., von Langermann, J., & Schmidt, T. (2010). Carbon dioxide and formic acid—the couple for environmental-friendly hydrogen storage? Energy & Environmental Science, 3(9), 1207. doi:10.1039/b907569k
- Pereira, I. a. C. (2013). An Enzymatic Route to H2 Storage. Science, 342(6164), 1329–1330. doi:10.1126/science.1247698
- Rice, C., Ha, S., Masel, R. I., Waszczuk, P., Wieckowski, A., & Barnard, T. (2002). Direct formic acid fuel cells. Journal of Power Sources, 111(1), 83–89. doi:10.1016/S0378-7753(02)00271-9
- Kjeang, E., Michel, R., Harrington, D. A., Sinton, D., & Djilali, N. (2008). An alkaline microfluidic fuel cell based on formate and hypochlorite bleach. Electrochimica Acta, 54(2), 698–705. doi:10.1016/j.electacta.2008.07.009
- Devroe, E.J. et al. Joule Biotechnologies. Hyperphotosynthetic organisms, US Patent 7,785,861
How do published genetic systems from photosynthetic organisms for producing isobutanol and sugar compare? For example, in the system described by Atsumi et al., approximately 80 mg/l of isobutyraldehyde is produced during the first day of induction, during which ca. 1.5 g of biomass is also produced. (The growth rate of the non-engineered organism under the same conditions was not provided.) Similarly, Niederholtmeyer et al. have found that engineered cyanobacteria secrete 32 mg/l under conditions in which the corresponding non-engineered strain generate approximately 0.5 g/l of cellular biomass. Thus, both systems direct in the range of 5–6% of their captured carbon into the desired product. By comparison, the efficiency of conversion of glucose into lactic acid by engineered yeast is often at least 80% (Ishida, N. et al. (2006) The Effect of Pyruvate Decarboxylase Gene Knockout in Saccharomyces cerevisiae on L-lactic Acid Production, Japan Society for Bioscience Biotechnology and Agrochemistry).
Other metabolically engineered organisms operate at a rate of 25–50% theoretical maximum efficiency. Clearly, the engineered pathways could be significantly improved. Such improvements would be independent of, and additive to, improvements in physical systems that optimize light and CO2 delivery, or genetic changes that improve the efficiency of light capture itself (Brenner, M.P. et al. (2006) Engineering Microorganisms for Energy Production. Report JSR-05-300, U. S. Department of Energy, (Washington, DC)).
Source: Ducat, D. C., Way, J. C., & Silver, P. A. (2011). Engineering cyanobacteria to generate high-value products. Trends in Biotechnology, 29(2), 103–95. doi:10.1016/j.tibtech.2010.12.003.
Intracellular Localization of Ribulose-1,5-Bisphosphate Carboxylase/ Oxygenase (RuBisCO) in Chlamydomonas reinhardtii and Ci (inorganic Carbon) Uptake:
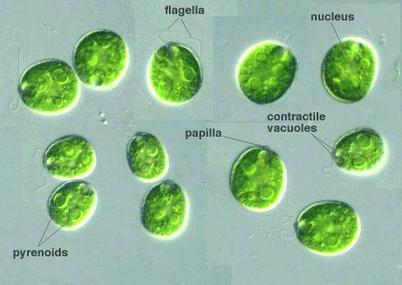 Pyrenoid structures in C. reinhardtii
Pyrenoids are electron-dense structures that are found in the plastids of most algae. When pyrenoids are isolated, the most abundant protein present is Rubisco (Kuchitsu et al., 1991; McKay and Gibbs, 1991; Okada, 1992).
The pyrenoid structure creates a microcompartment with elevated levels of CO2 to enhance the carboxylation reaction. Rubisco is localized to the pyrenoid structure in many, if not most, eukaryotic algae, including Chlamydomonas (Rawat et al., 1996; Morita et al., 1997; Borkhsenious et al., 1998). This localization is initiated by low-CO2, as Rubisco is initially evenly distributed across the chloroplast stroma in carbon-replete conditions. In addition, a starch sheath forms around the pyrenoid in low-CO2 conditions. It is believed that Rubisco functions as part of the structure of pyrenoid, as mutants that lack Rubisco fail to form a pyrenoid structure (Rawat et al., 1996). Studies utilizing chimeric Rubisco enzymes (small subunits were taken from various plants and combined with the large subunit from Chlamydomonas) not only showed defects in the function of the CCM, but also the inability to form a pyrenoid (Genkov et al., 2010).
Because the pyrenoid is the primary site of carbon fixation, it is believed that one of its prime functions is the maintenance of artificially high levels of CO2. The cia6 mutant, lacking a putative methyltransferase, lacked an organized pyrenoid (Ma et al., 2011). This mutant, despite normal levels of Rubisco, showed limited growth in low-CO2 environments - again highlighting the critical nature of this structure. The LCIB/LCIC complex has been found to surround the pyrenoid under low CO2 conditions (Yamano et al., 2010). It is possible that this complex works in conjunction with CAH6 (a stromal associated carbonic anhydrase) to act in limiting CO2 leakage from the pyrenoid. The pyrenoid and its surrounding proteins may act as a physical barrier, an enzymatic barrier, or both, in limiting loss of CO2.
The exact amount of Rubisco present in the pyrenoid is controversial. Estimates of the amount of Rubisco in the pyrenoid versus the amount in the entire chloroplast range from 60% or higher (Vladimirova et al., 1982; Lacoste-Royal and Gibbs, 1987; Morita et al., 1997) to as low as 5% (Süss et al., 1995). The distribution of Rubisco in C. reinhardtii under a variety of growth conditions, including high and low CO2 concentrations has been investigated.
When the relative volumes of the pyrenoid and the stroma are taken into account (Lacoste-Royal and Gibbs, 1987), it is clear that almost all of the Rubisco appears to be localized to the pyrenoid in C. reinhardtii cells grown under low levels of CO2. Similar calculations using data from the high-CO2-grown cells show that a significant fraction (approximately 60%) of the Rubisco is localized to the chloroplast stroma in those cells (Table I). These data imply that the localization of Rubisco in C. reinhardtii depends in part on the growth conditions of the organism.
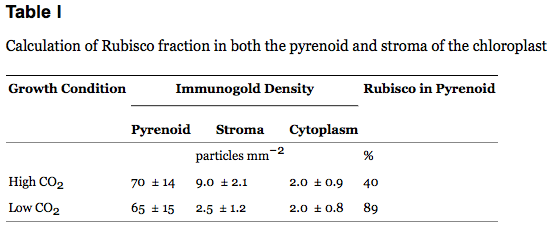
The finding of RuBisCO in the pyrenoid has raised the question of whether pyrenoidal RuBisCO is active in CO2 fixation. Clearly, if 100% of the RuBisCO is localized to the pyrenoid then RuBisCO must be active. However, even if a lower estimate of the amount of RuBisCO in the pyrenoid is used, our activity measurements are consistent with the idea that pyrenoidal RuBisCO is active in vivo. RuBisCO activity measurements indicate that there is not an excess of RuBisCO activity in the cell, and that most of the RuBisCO in the cell must be active to account for the levels of CO2 fixation observed in whole cells. Because 90% of the RuBisCO is localized to the pyrenoid when cells are grown on low CO2 these results are consistent with the idea that the primary location of CO2 fixation in C. reinhardtii is the pyrenoid.
A specific localization of RuBisCO to the pyrenoid is compatible with the view that organisms with CO2-concentrating mechanisms package Rubisco in very specific fashions. The most analogous situation is found in cyanobacteria, in which RuBisCO is found in carboxysomes (Codd and Marsden, 1984; Reinhold et al., 1991). In cyanobacteria it appears that the CO2 level is elevated within the carboxysome, thus favoring the carboxylation activity of Rubisco over the oxygenase activity. The pyrenoid may serve the same function in C. reinhardtii and other eukaryotic algae.
Source: Borkhsenious, O., Mason, C., & Moroney, J. (1998). The intracellular localization of ribulose-1,5-bisphosphate Carboxylase/Oxygenase in chlamydomonas reinhardtii. Plant Physiology, 116(4), 1585–91.
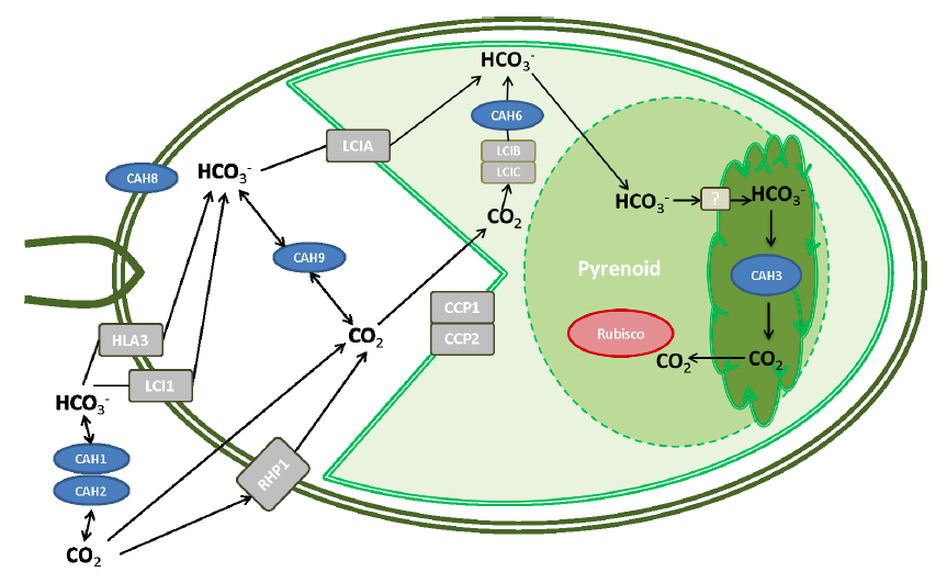
Representation of the Chlamydomonas carbon concentrating mechanisms: depicted are most of the recognized CCM components. For brevity, some of the lesser-characterized putative CCM components have not been included in this figure. Blue ovals represent carbonic anhydrases, grey rectangles represent Ci (inorganic carbon) transporters or scavengers, and a red oval represents Rubisco.
Ci (inorganic Carbon) Uptake:
Like cyanobacteria, Chlamydomonas actively imports Ci as both CO2 and HCO3-. As a charged molecule, HCO3- requires transporters to migrate across the membranes of Chlamydomonas (Spalding, 2008). The uncharged nature of CO2 allows it to diffuse through the membranes (Prins and Elzenga, 1989). This diffusion may be assisted by aquaporins (Calamita et al., 1997) and Rhesus proteins (Soupene et al., 2004; Kustu and Inwood, 2006). However, maintenance by the cell of a higher internal concentration of Ci than the external environment is an endergonic reaction requiring energy from photosynthesis.
Conversion of CO2 to HCO3- by carbonic anhydrases in the cytoplasm and chloroplast stroma plays a significant role in preventing loss of Ci from the cell due to outward diffusion of CO2.
Ci (inorganic carbon) Uptake across the Plasma Membrane:
Currently, two putative Chlamydomonas HCO3- transporters have been identified in the plasma membrane: HLA3 and LCI1 (Duanmu et al., 2009a; Ohnishi et al., 2010). The corresponding genes for these two transporters have both shown an increase in expression in response to carbon-depletion.
HLA3 has been annotated as an ATP Binding Cassette (ABC) transporter with homology to the multi-drug-resistance (MRP) sub-family of proteins (Im and Grossman, 2002). The presence of a complete ABC-HRP domain arrangement makes HLA3 a likely candidate as a single component transporter, not requiring dimerization or complex formation. Duanmu et al. (2009a) utilized RNAi to knock down transcript levels of HLA3. The RNAi (RNA interference) cell lines showed significant decreases in photosynthetic Ci affinity and uptake. This was especially notable under alkaline conditions (where HCO3- predominates as the Ci species). Combinations of HLA3 knockdown with knockdown of other CCM components produced additional decreases in Ci affinity and uptake, further strengthening the suggestion that HLA3 plays a role as a HCO3- transporter in the plasma membrane. Like many CCM-associated genes, expression of HLA3 appears to be controlled by CIA5 (Xiang et al., 2001; Im and Grossman, 2002; Miura et al., 2004; Wang et al., 2005; Yamano et al., 2008; Fang et al., 2012). Mutants lacking the CIA5 gene show no induction of HLA3 following a shift to low-CO2 levels. The second putative Ci transporter of the plasma membrane is LCI1. LCI1 has been characterized as localized to both the plasma and nuclear membranes (Ohnishi et al., 2010). LCI1 was artificially over expressed in the lcr1 mutant (under conditions in which several components, including LCI1, fail to induce) to better characterize the potential function(s) of this protein. Increased LCI1 was shown to increase photosynthetic Ci affinity and uptake. There is an ambiguity regarding the carbon species that is transported by LCI1. LCI1 appeared to increase Ci affinity and accumulation at high pH, suggesting it may have a role as a HCO3- transporter. However, no differences were seen in light-dependent CO2 gas exchange at different pH levels, leaving an ambiguity as to the Ci species preferred by this transporter. Like HLA3, LCI1 was found to be a low-CO2 inducible gene regulated by CIA5 (Burow et al., 1996; Im et al., 2003; Miura et al., 2004). Interestingly, studies by Yoshioka et al. (2004) showed LCI1 to also be regulated by the gene LCR1, apparently downstream of CIA5.
Ci Uptake across the Chloroplast Inner Envelope Membrane:
As noted above, following its uptake into the cell across the cellular membrane, Ci is largely hydrated to HCO3-, helping to reduce leakage of Ci from the cell. However, Ci still needs to enter the chloroplast to be utilized for carbon fixation. For HCO3-, several proteins may be critical for its transport into the chloroplast. Currently, four genes are being considered as putative chloroplast-localized bicarbonate transporters.
The first two putative bicarbonate transporters are CCP1 and CCP2 (Chloroplast Carrier Protein) (Chen et al., 1997; Pollock et al., 2004). The genes encoding these proteins are nearly identical in sequence, and are likely the result of a recent genome duplication event. Both have been shown to be induced by low-CO2 conditions and to be regulated by CIA5. Unfortunately, no knockouts of these genes are currently available.
LCIA, or NAR1.2, is a member of the Formate/Nitrite Transporter (FNT) family of proteins. It shows perhaps the largest response to low-CO2, being induced nearly 4000-fold, and is also under the control of CIA5 (Miura et al., 2004; Wang et al., 2005; Yamano et al., 2008; Fang et al., 2012). Studies in which LCIA was introduced into Xenopus oocytes showed LCIA to function as a low-affinity bicarbonate and a high-affinity nitrite transporter (Mariscal et al., 2006). While the subcellular location of LCIA has not yet been characterized, sequence analysis shows a putative chloroplast transit peptide.
When NH4+ (ammonium) was the sole nitrogen source, LCIA showed a low-CO2 induction response (Mukherjee, 2013). Interestingly, when NO3- (nitrate) was the sole nitrogen source, LCIA maintained high expression in the presence of both high- and low-CO2. This suggests the possibility that, in an environment where NO3- (nitrate) is the predominate nitrogen source, LCIA is required for NO2- transport, irrespective of CO2 levels, whereas when NH4+ is present,
LCIA can respond to CO2 levels.
YCF10, a plastid-encoded gene related to CemA of plant plastids, also has been proposed to function as a transporter of bicarbonate across the chloroplast inner membrane (Rolland et al., 1997). However, unlike CCP1, CCP2, and LCIA, this gene is not regulated by CIA5.
Ci Uptake across the Chloroplast Thylakoid Membrane:
Interestingly, no transporters have been identified that may aid in Ci transport across the thylakoid membrane. However, a family of proteins (LCIB, LCIC, LCID, & LCIE) is believed to potentially facilitate Ci uptake and/or retention. Spalding, Spreitzer, and Ogren (1983b) characterized a high CO2-requiring mutant, pmp-1 that was later shown to lack the LCIB protein and failed to accumulate Ci in low-CO2. This mutant was believed to be deficient in Ci uptake. However, this gene product lacks a transmembrane domain in its protein. It is believed that LCIB functions in complex with LCIC to retain CO2 in the chloroplast or assist in Ci transport within the chloroplast (Yamano and Fukuzawa, 2009; Yamano et al., 2010). LCIB also functions epistatically downstream of CAH3, a carbonic anhydrase localized in the thylakoid lumen, adding further mystery as to its precise function (Duanmu et al., 2009b).
Mutant strains of Chlamydomonas lacking the CAH3 gene barely survived under low CO2 conditions and, although Ci was over accumulated in the thylakoid lumen, insufficient levels of CO2 were available for Rubisco (Spalding et al., 1983a; Moroney et al., 1986; Funke et al., 1997; Karlsson et al., 1998; Hanson et al., 2003). It is believed, then, that CAH3 is involved in the conversion of HCO3- to CO2 within the chloroplast lumen - a process favored by the acidic environment of the lumen (Pronina and Semenenko, 1992; Karlsson et al., 1998; Moroney and Somanchi, 1999; Hanson et al., 2003). In the absence of CAH3, HCO3- ions entering the lumen would largely remain hydrated, limiting the amount of CO2 available for Rubisco in the pyrenoid (Spalding et al., 1983a; Moroney et al., 1986). Unlike many CCM components, CAH3 shows only a mild up-regulation in response to low-CO2 environments (Karlsson et al., 1998; Im et al., 2003; Wang and Spalding, 2006; Ynalvez et al., 2008; Yamano and Fukuzawa, 2009; Fang et al., 2012). Despite the lack of induction by low-CO2, CAH3 has been shown to be under control of the transcriptional regulator CIA5, as its expression is absent in cia5 cells (Moroney et al., 1989; Marek and Spalding, 1991; Ynalvez et al., 2008).
Mitochondrial Carbonic Anhydrases (CAs):
While the chloroplast appears to be paramount to the CCM, it should be noted that the mitochondria are not without a role in this mechanism. Two mitochondrial CAs, CAH4 & CAH5, were isolated from Chlamydomonas (Villand et al., 1997).
Like CAH1 and CAH2, these proteins share a high level of sequence identity, and are also believed to be the result of a recent duplication event within the genome. The genes encoding these proteins are responsive to low-CO2, as well as being under the control of CIA5 (Fujiwara et al., 1990; Ynalvez et al., 2008; Fang et al., 2012). The roles of CAH4 and CAH5 may be two-fold in Chlamydomonas. When subjected to low-CO2 environments, mitochondria are found to migrate around the periphery of the chloroplast, and CAH4 and CAH5 may function in the capture of CO2 escaping the chloroplast (rapidly converting these molecules to HCO3-, which can be better-retained by the cell) (Giordano et al., 2003; Moroney et al., 2011). Additionally, CAH4 and CAH5 may function in the rehydration of CO2 produced by photorespiration, namely, the glycine decarboxylase complex (Giordano et al., 2003).
Source: Brueggeman, A. J. (2013). Transcriptomic Analyses of the CO2 - Concentrating Mechanisms and Development of Molecular Tools for Chlamydomonas reinhardtii. University of Nebraska - Lincoln.
Regulatory Responses in Chlamydomonas associated with the CCM - Detection of Carbon Levels
While the exact mechanism(s) has not yet been identified, Chlamydomonas cells are able to rapidly detect changes in external CO2 levels. This detection does not appear to be influenced by HCO3- ion levels or the pH, suggesting some form of detection located within the plasma membrane (Matsuda and Colman, 1995; Bozzo and Colman, 2000; Giordano et al., 2005).
Because of its nuclear location, it is unlikely that CIA5 is a direct sensor of CO2 levels. Most likely, CIA5 response to changes in external CO2 levels requires transduction of a signal from outside or within the cell membrane (Kohinata et al., 2008).
In addition to CO2 levels, light is another factor implicated in CCM responses. Some genes, including CAH1, appear to be induced in the dark, while other CIA5-controlled genes, such as CAH4/CAH5, require light for induction (Villarejo et al., 1997). Considering that, by driving photosynthesis, light would cause depletion of internal carbon levels. In this regard, rescue (or lack thereof) of internal carbon levels could potentially provide a useful reflection of environmental CO2 conditions. Subsequently, a reduction in Ci could affect the redox potential of the photosynthetic electron transport system, which could also serve as a signal to the cell (Spalding and Ogren, 1982; Spencer et al., 1983; Fukuzawa et al., 1990b; Villarejo et al., 1997).
Alternatively, depletion of internal Ci would cause an increase in oxygenation reactions by Rubisco, and subsequent accumulation of photorespiratory metabolites could function as signals to the cell. Lending support to this later hypothesis is evidence that several CO2-responsive genes, including CAH1, CAH4, & CAH5, were not induced by low CO2 when the glycolate pathway (see Photorespiration) was inhibited (Spalding and Ogren, 1982; Ramazanov and Cardenas, 1992; Villarejo et al., 1997).
Regardless of such speculation, no firm evidence exists in regard to the nature of the signal(s) used by Chlamydomonas to control the activity of the CCM in response to changes in external CO2 concentrations.
Induction of the CCM (carbon concentrating mechanism):
Study of carbon assimilation in Chlamydomonas showed significant differences in the alga’s affinity for Ci in relation to environmental conditions; specifically, Chlamydomonas showed higher affinity for Ci in carbon-depleted environments (≤390ppm CO2) than in carbon-replete environments (1-5% CO2) (Badger and Price, 1994). In addition, structural changes, including formation and localization of Rubisco to the pyrenoid, and migration of mitochondria to the membrane periphery, coincide with
these low-CO2 environments (Kuchitsu et al., 1988, 1991; Ramazanov et al., 1994; Geraghty and Spalding, 1996; Thyssen et al., 2001). Changes in gene expression also coincide with carbon-depleted environments. By the early 1990s, gene expression
studies were being conducted to identify genes that showed a low-CO2 response. Differential display (Im and Grossman, 2002) and EST-based microarray assays (Im et al., 2003; Miura et al., 2004; Wang et al., 2005; Yamano et al., 2008) were among some of
the earlier works dedicated to identifying CO2-responsive genes. These efforts have been expanded significantly by recent RNA-sequencing studies (Fang et al., 2012).
As noted above, the CCM-deficient Chlamydomonas mutant, cia5 (Ci acquisition mutant #5), isolated in 1989, has proven the most powerful tool yet available for studies of the regulation of the CCM. This mutant has led to insights into the function and control of the CCM that, otherwise, would not have been possible. The cia5 mutant, generated by UV irradiation, lacked a functional CCM, and was unable to survive in low-CO2 environments (Moroney et al., 1989; Marek and Spalding, 1991). Independent
efforts to complement this mutant led to isolation and characterization of the CIA5/CCM1 gene (Fukuzawa et al., 2001; Xiang et al., 2001). This gene, containing two N-terminal zinc finger motifs, appeared to be a characteristic transcriptional activator. To date, researchers have been unable to show any ability of CIA5 to directly bind DNA (Kohinata et al., 2008). The regulatory role of this protein, however, is without question, as several CAs (CAH1, CAH3, CAH4, CAH5), transporters (HLA3, LCI1, CCP1, CCP2, LCIA), and additional CCM components fail to be induced in low CO2 without the presence of CIA5. Interestingly, however, levels of CIA5 itself do not change in response to low-CO2, suggesting that it serves as sentinel in anticipation of the need for rapid changes in gene expression patterns when external CO2 levels decrease or increase (Xiang et al., 2001; Moroney and Ynalvez, 2007; Kohinata et al., 2008; Wang et al., 2011). Another gene, LCR1, was found to act downstream of CIA5 to control transcription of a subset of CO2-responsive genes (Yoshioka et al., 2004). Mutant cells lacking a functional LCR1 failed to induce a subset of the CIA5-controlled low-CO2-inducible genes. This suggests the possibility that CIA5 functions in activating multiple proteins that each regulate different subsets of CO2-responsive genes.
Source: Brueggeman, A. J. (2013). Transcriptomic Analyses of the CO2 - Concentrating Mechanisms and Development of Molecular Tools for Chlamydomonas reinhardtii. University of Nebraska - Lincoln.
The Carbon Cycle:
Forged in the heart of aging stars, carbon is the fourth most abundant element in the Universe. Most of Earth’s carbon—about 65,500 billion metric tons—is stored in rocks. The rest is in the ocean, atmosphere, plants, soil, and fossil fuels.
Carbon flows between each reservoir in an exchange called the carbon cycle, which has slow and fast components. Any change in the cycle that shifts carbon out of one reservoir puts more carbon in the other reservoirs. Changes that put carbon gases into the atmosphere result in warmer temperatures on Earth.
Over the long term, the carbon cycle seems to maintain a balance that prevents all of Earth’s carbon from entering the atmosphere (as is the case on Venus) or from being stored entirely in rocks. This balance helps keep Earth’s temperature relatively stable, like a thermostat.
This thermostat works over a few hundred thousand years, as part of the slow carbon cycle. This means that for shorter time periods—tens to a hundred thousand years—the temperature of Earth can vary. And, in fact, Earth swings between ice ages and warmer interglacial periods on these time scales. Parts of the carbon cycle may even amplify these short-term temperature changes.
The Slow Carbon Cycle: Through a series of chemical reactions and tectonic activity, carbon takes between 100-200 million years to move between rocks, soil, ocean, and atmosphere in the slow carbon cycle. On average, 10e13 to 10e14 grams (10–100 million metric tons) of carbon move through the slow carbon cycle every year. In comparison, human emissions of carbon to the atmosphere are on the order of 10e15 grams, whereas the fast carbon cycle moves 10e16 to 10e17 grams of carbon per year.
The movement of carbon from the atmosphere to the lithosphere (rocks) begins with rain. Atmospheric carbon combines with water to form a weak acid—carbonic acid—that falls to the surface in rain. The acid dissolves rocks—a process called chemical weathering—and releases calcium, magnesium, potassium, or sodium ions. Rivers carry the ions to the ocean. In the ocean, the calcium ions combine with bicarbonate ions to form calcium carbonate, the active ingredient in antacids and the chalky white substance that dries on your faucet if you live in an area with hard water. In the modern ocean, most of the calcium carbonate is made by shell-building (calcifying) organisms (such as corals) and plankton (like coccolithophores and foraminifera). After the organisms die, they sink to the seafloor. Over time, layers of shells and sediment are cemented together and turn to rock, storing the carbon in stone—limestone and its derivatives. Only 80 percent of carbon-containing rock is currently made this way. The remaining 20 percent contain carbon from living things (organic carbon) that have been embedded in layers of mud. Heat and pressure compress the mud and carbon over millions of years, forming sedimentary rock such as shale. In special cases, when dead plant matter builds up faster than it can decay, layers of organic carbon become oil, coal, or natural gas instead of sedimentary rock like shale.
The slow cycle returns carbon to the atmosphere through volcanoes. Earth’s land and ocean surfaces sit on several moving crustal plates. When the plates collide, one sinks beneath the other, and the rock it carries melts under the extreme heat and pressure. The heated rock recombines into silicate minerals, releasing carbon dioxide. When volcanoes erupt, they vent the gas to the atmosphere and cover the land with fresh silicate rock to begin the cycle again. At present, volcanoes emit between 130 and 380 million metric tons of carbon dioxide per year. For comparison, humans emit about 30 billion tons of carbon dioxide per year—100–300 times more than volcanoes—by burning fossil fuels. Chemistry regulates this dance between ocean, land, and atmosphere. If carbon dioxide rises in the atmosphere because of an increase in volcanic activity, for example, temperatures rise, leading to more rain, which dissolves more rock, creating more ions that will eventually deposit more carbon on the ocean floor. It takes a few hundred thousand years to rebalance the slow carbon cycle through chemical weathering.
However, the slow carbon cycle also contains a slightly faster component: the ocean. At the surface, where air meets water, carbon dioxide gas dissolves in and ventilates out of the ocean in a steady exchange with the atmosphere. Once in the ocean, carbon dioxide gas reacts with water molecules to release hydrogen, making the ocean more acidic. The hydrogen reacts with carbonate from rock weathering to produce bicarbonate ions.
Before the industrial age, the ocean vented carbon dioxide to the atmosphere in balance with the carbon the ocean received during rock weathering. However, since carbon concentrations in the atmosphere have increased, the ocean now takes more carbon from the atmosphere than it releases. Over millennia, the ocean will absorb up to 85 percent of the extra carbon people have put into the atmosphere by burning fossil fuels, but the process is slow because it is tied to the movement of water from the ocean’s surface to its depths. In the meantime, winds, currents, and temperature control the rate at which the ocean takes carbon dioxide from the atmosphere. It is likely that changes in ocean temperatures and currents helped remove carbon from and then restore carbon to the atmosphere over the few thousand years in which the ice ages began and ended.
The Fast Carbon Cycle: The time it takes carbon to move through the fast carbon cycle is measured in a lifespan. The fast carbon cycle is largely the movement of carbon through life forms on Earth, or the biosphere. Between 10e15 and 10e17 grams (1 Gigaton (Gt) or 1,000 million metric tons to 100 Gigatons or 100,000 million metric tons) of carbon move through the fast carbon cycle every year:
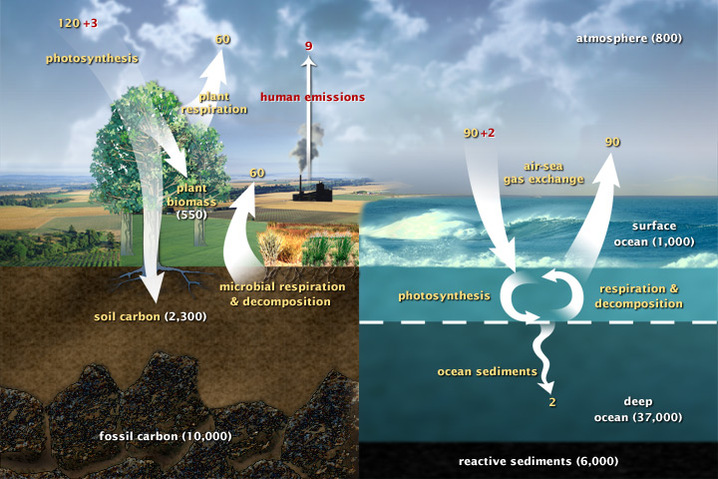
These diagrams of the fast carbon cycle shows the movement of carbon between land, atmosphere, and oceans. Above: GtC/y = Gigatons of carbon per year.
Below: Yellow numbers are natural fluxes, and red are human contributions in gigatons of carbon per year. White numbers indicate stored carbon. (Diagram adapted from U.S. DOE, Biological and Environmental Research Information System.)
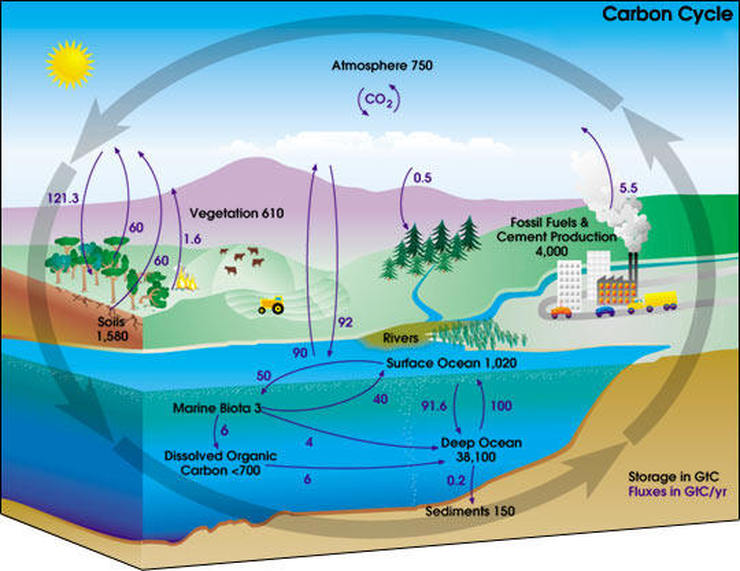
Carbon plays an essential role in biology because of its ability to form many bonds—up to four per atom—in a seemingly endless variety of complex organic molecules. Many organic molecules contain carbon atoms that have formed strong bonds to other carbon atoms, combining into long chains and rings. Such carbon chains and rings are the basis of living cells. For instance, DNA is made of two intertwined molecules built around a carbon chain.
The bonds in the long carbon chains contain a lot of energy. When the chains break apart, the stored energy is released. This energy makes carbon molecules an excellent source of fuel for all living things. Plants and phytoplankton are the main components of the fast carbon cycle. Phytoplankton (microscopic organisms in the ocean) and plants take carbon dioxide from the atmosphere by absorbing it into their cells. Using energy from the Sun, both plants and plankton combine carbon dioxide (CO2) and water to form sugar (CH2O) and oxygen. The chemical reaction looks like this:
CO2 + H2O + energy = CH2O + O2
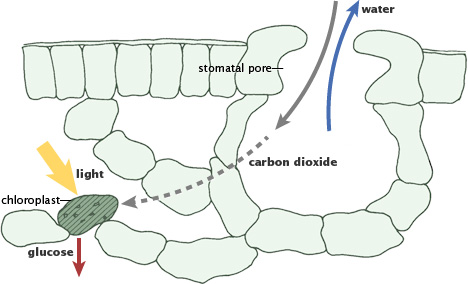
During photosynthesis, plants absorb carbon dioxide and sunlight to create fuel—glucose and other sugars—for building plant structures. This process forms the foundation of the fast (biological) carbon cycle. (Illustration adapted from P.J. Sellers et al., 1992.)
Four things can happen to move carbon from a plant and return it to the atmosphere, but all involve the same chemical reaction. Plants break down the sugar to get the energy they need to grow. Animals (including people) eat the plants or plankton, and break down the plant sugar to get energy. Plants and plankton die and decay (are eaten by bacteria) at the end of the growing season. Or fire consumes plants. In each case, oxygen combines with sugar to release water, carbon dioxide, and energy. The basic chemical reaction looks like this:
CH2O + O2 = CO2 + H2O + energy
In all four processes, the carbon dioxide released in the reaction usually ends up in the atmosphere. The fast carbon cycle is so tightly tied to plant life that the growing season can be seen by the way carbon dioxide fluctuates in the atmosphere. In the Northern Hemisphere winter, when few land plants are growing and many are decaying, atmospheric carbon dioxide concentrations climb. During the spring, when plants begin growing again, concentrations drop. It is as if the Earth is breathing.
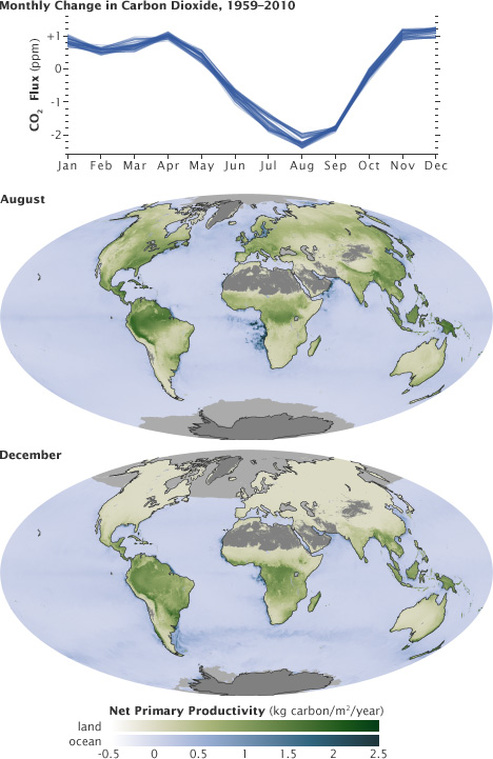
The ebb and flow of the fast carbon cycle is visible in the changing seasons. As the large land masses of Northern Hemisphere green in the spring and summer, they draw carbon out of the atmosphere.
This cycle peaks in August, with about 2 parts per million of carbon dioxide drawn out of the atmosphere. In the fall and winter, as vegetation dies back in the northern hemisphere, decomposition and respiration returns carbon dioxide to the atmosphere.
These maps show net primary productivity (the amount of carbon consumed by plants) on land (green) and in the oceans (blue) during August and December, 2010. In August, the green areas of North America, Europe, and Asia represent plants using carbon from the atmosphere to grow. In December, net primary productivity at high latitudes is negative, which outweighs the seasonal increase in vegetation in the southern hemisphere. As a result, the amount of carbon dioxide in the atmosphere increases. (Graph by Marit Jentoft-Nilsen and Robert Simmon, using data from the NOAA Earth System Research Laboratory. Maps by Robert Simmon and Reto Stöckli, using MODIS data.)
